Every day your website can face a wide range of threats: Website updates, server configuration changes, out of date URLs or 3rd party plugins and services can cause broken links, missing images or errors on your website.
In eCommerce, first impressions matter, a lot. If your visitor’s first impression of your business is a page with warnings or missing assets, this visit will likely be their last.
To make matters worse these types of issues are typically difficult to find as they tend to affect specific pages only, so you’re essentially looking for a needle in a haystack of thousands of pages.
In this tutorial we will walk you through how Hexometer provides peace of mind by comprehensively monitoring your entire website for health issues.
Hexometer works 24/7 behind the scenes monitoring your website health via four key vectors:
Checking your pages or urls for errors, checking your pages for valid W3C markup, detecting Javascript errors and identifying changes in your tech stack.

Monitoring your website for server errors and broken links
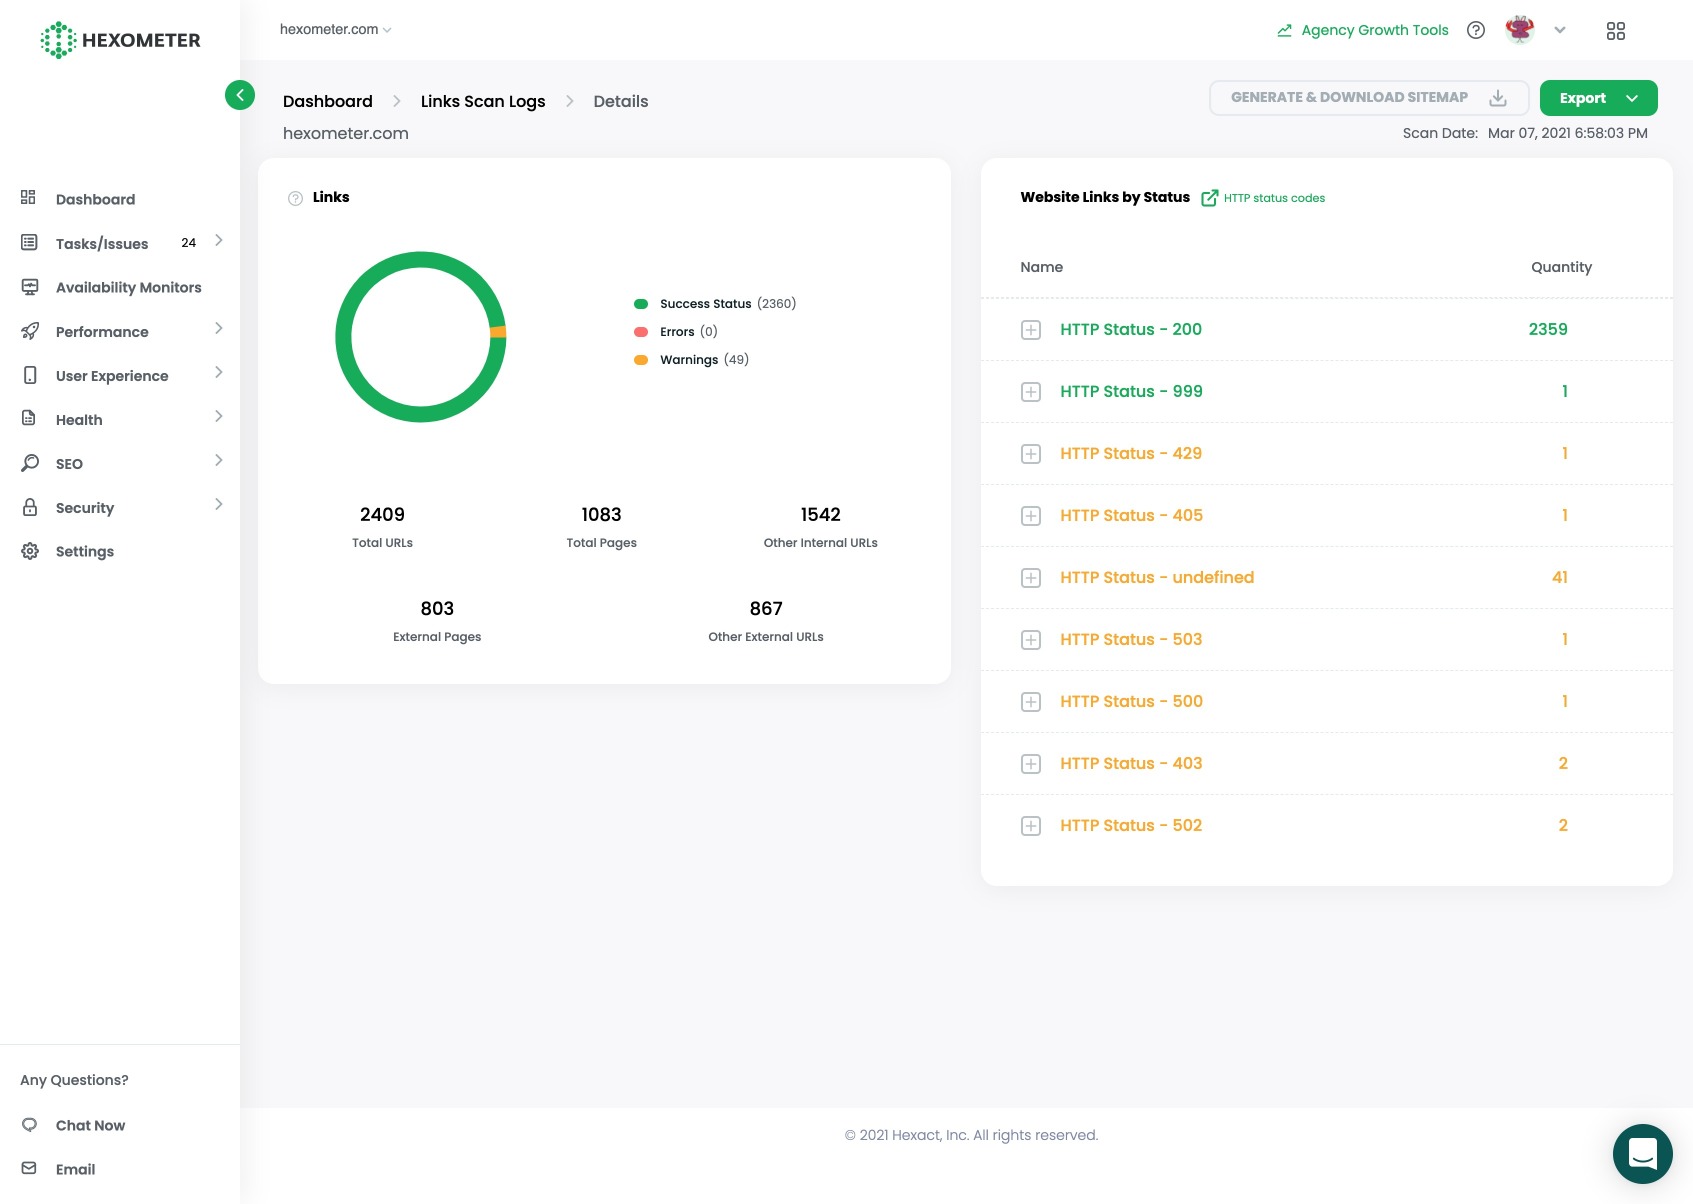
You can find a top level view of detected internal and external errors in the Links section. To see a detailed breakdown for a specific date click on the details link.

When you click on a specific date, you will find an in-depth analysis of all your pages, links and assets scanned.
This section identifies internal links belonging to your website as well as external links from 3rd party services or external pages your website links to.
Hexometer then organizes these links by HTTP status code so you can easily identify problems.
Results can then be exported to CSV or Google sheets for further analysis or to pass to your IT team to fix.
W3C markup monitoring
To ensure your website runs optimally, Hexometer can also perform in-depth W3C validation checks to assess your source code to detect any markup issues or errors that could prevent your pages from displaying as intended.
Our smart crawler will automatically run checks throughout the week on your most recent or most frequently accessed pages.
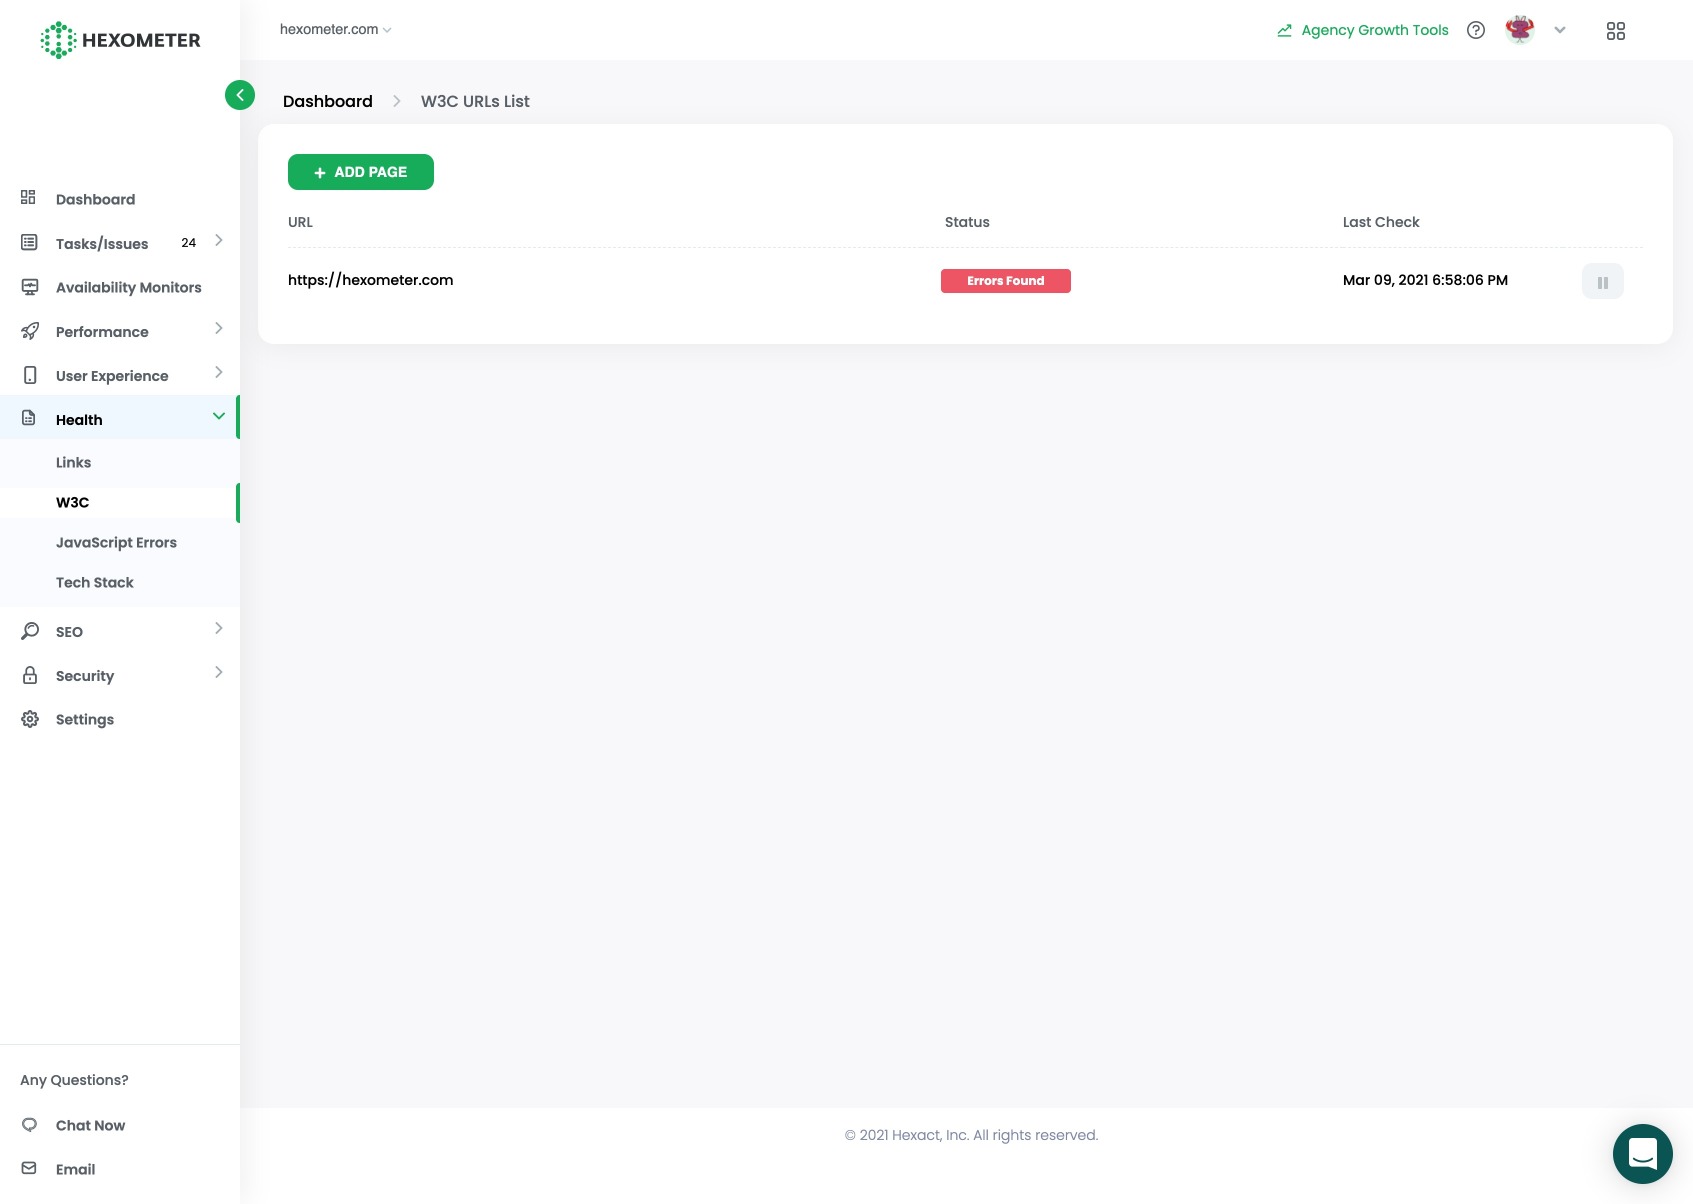
You can also run on-demand checks on your most important pages, scheduling these for additional peace of mind by clicking add page.
You can then access historical W3C validation reports and stats on a page by page basis.
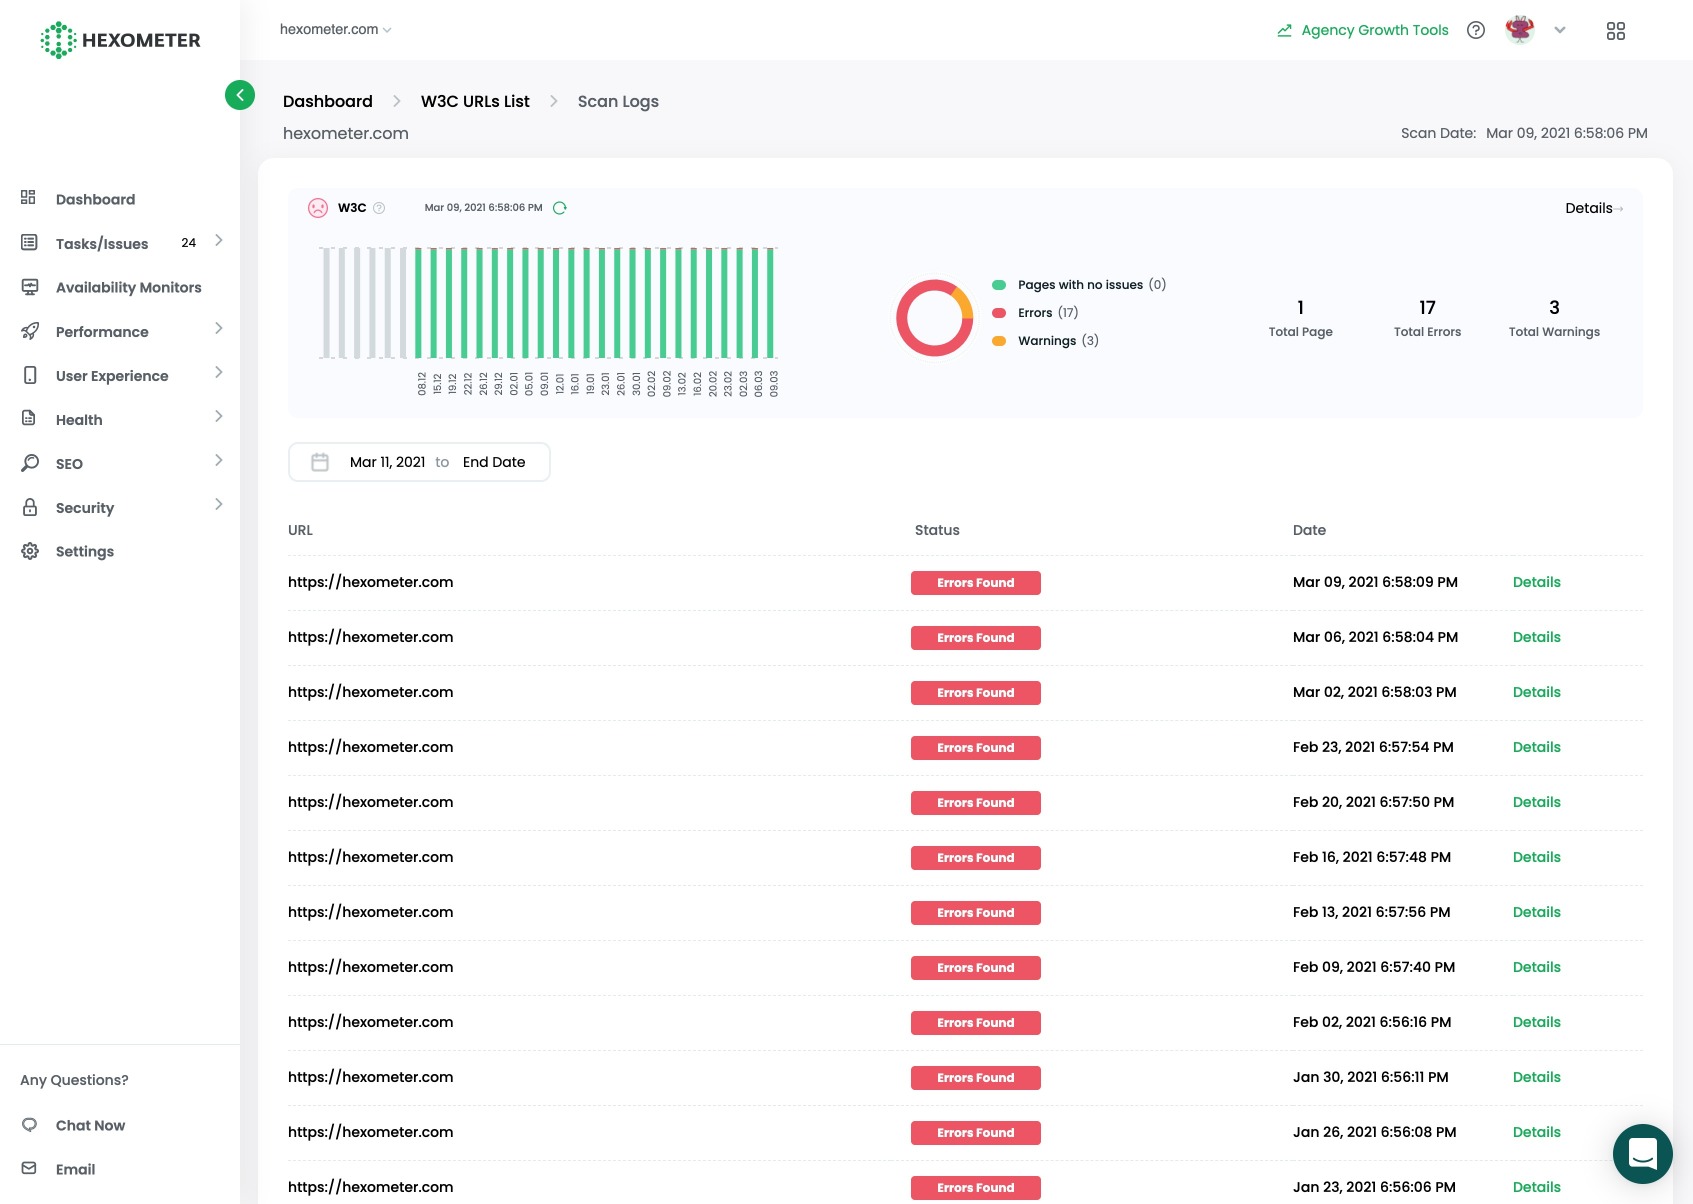
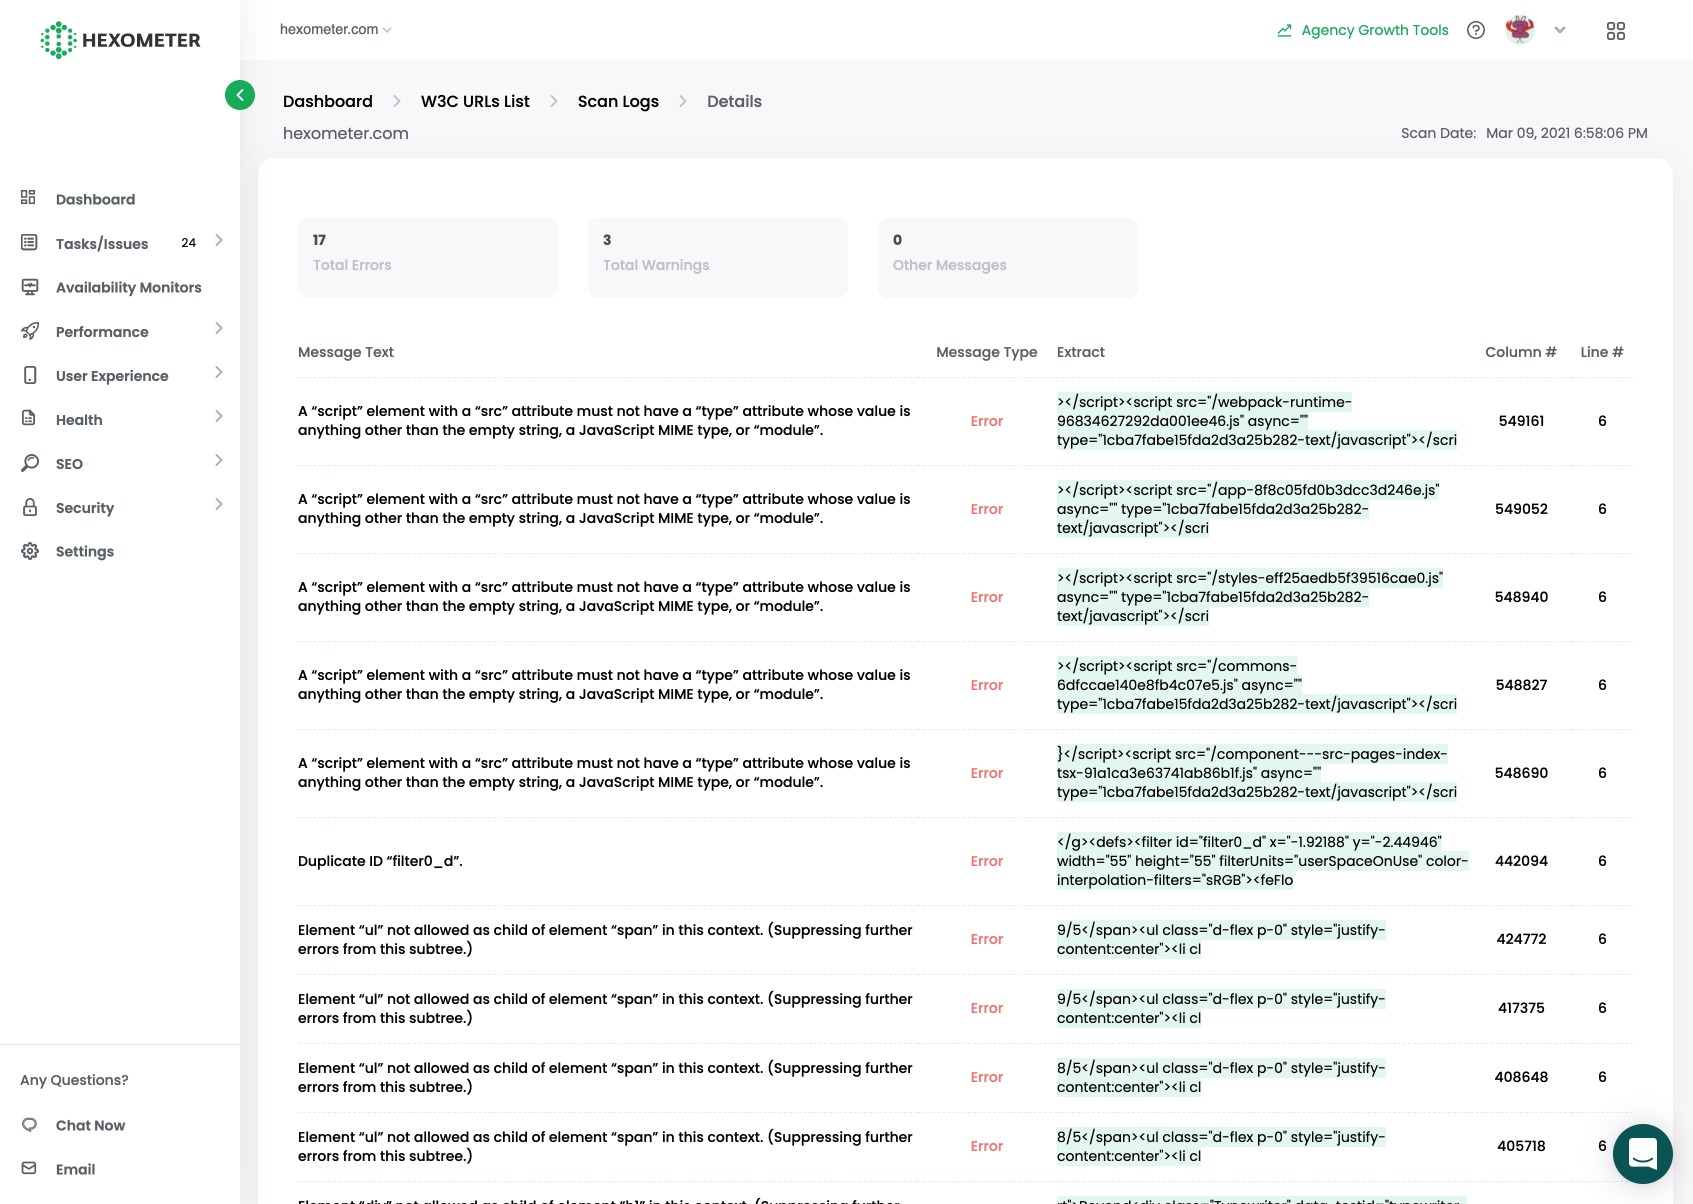
To access your W3C report, click on details for your desired date.
Monitor your pages for JavaScript errors and warnings
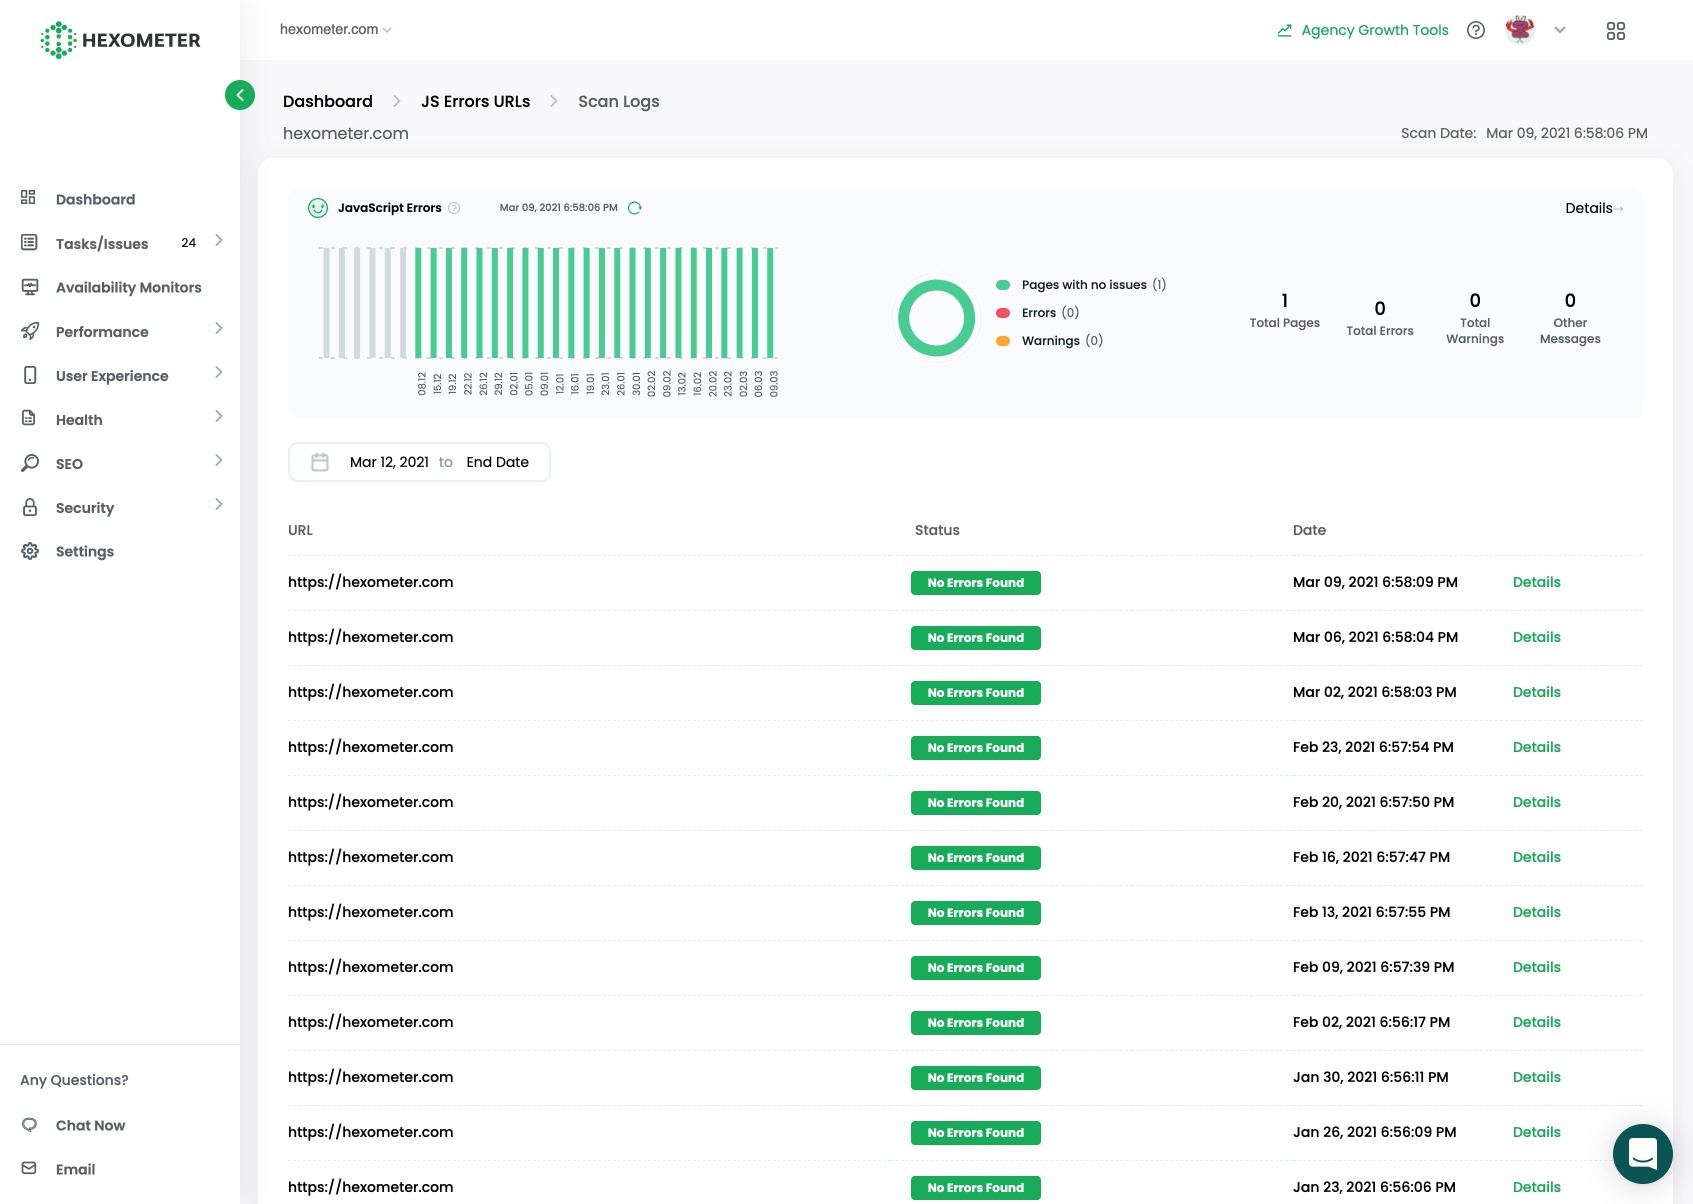
JavaScript is ubiquitous, powering the UI, tracking and dynamic features found on most websites today. The problem with JavaScript is that a single error can stop all scripts on a page from working.
Errors can stem from website updates, out of date code or changes made in 3rd party scripts causing compatibility issues. To make matters worse, errors can be page specific and only noticeable when something stops working or by digging into the developer options to see the error notification.
Hexometer provides peace of mind by checking your homepage and your most important pages for JavaScript errors on auto-pilot.

You can also run on-demand checks on any page to diagnose issues, with the option to schedule these on a daily, weekly or monthly basis to keep a close eye on your most mission critical pages.
Monitor your tech stack for changes
Websites typically depend on a wide variety of libraries, 3rd party scripts and services for UI, analytics, customer support, or marketing features.
Should any of these scripts or libraries go missing it could mean loss of analytics tracking, features not working, chat support going offline or marketing tools not working on your website.
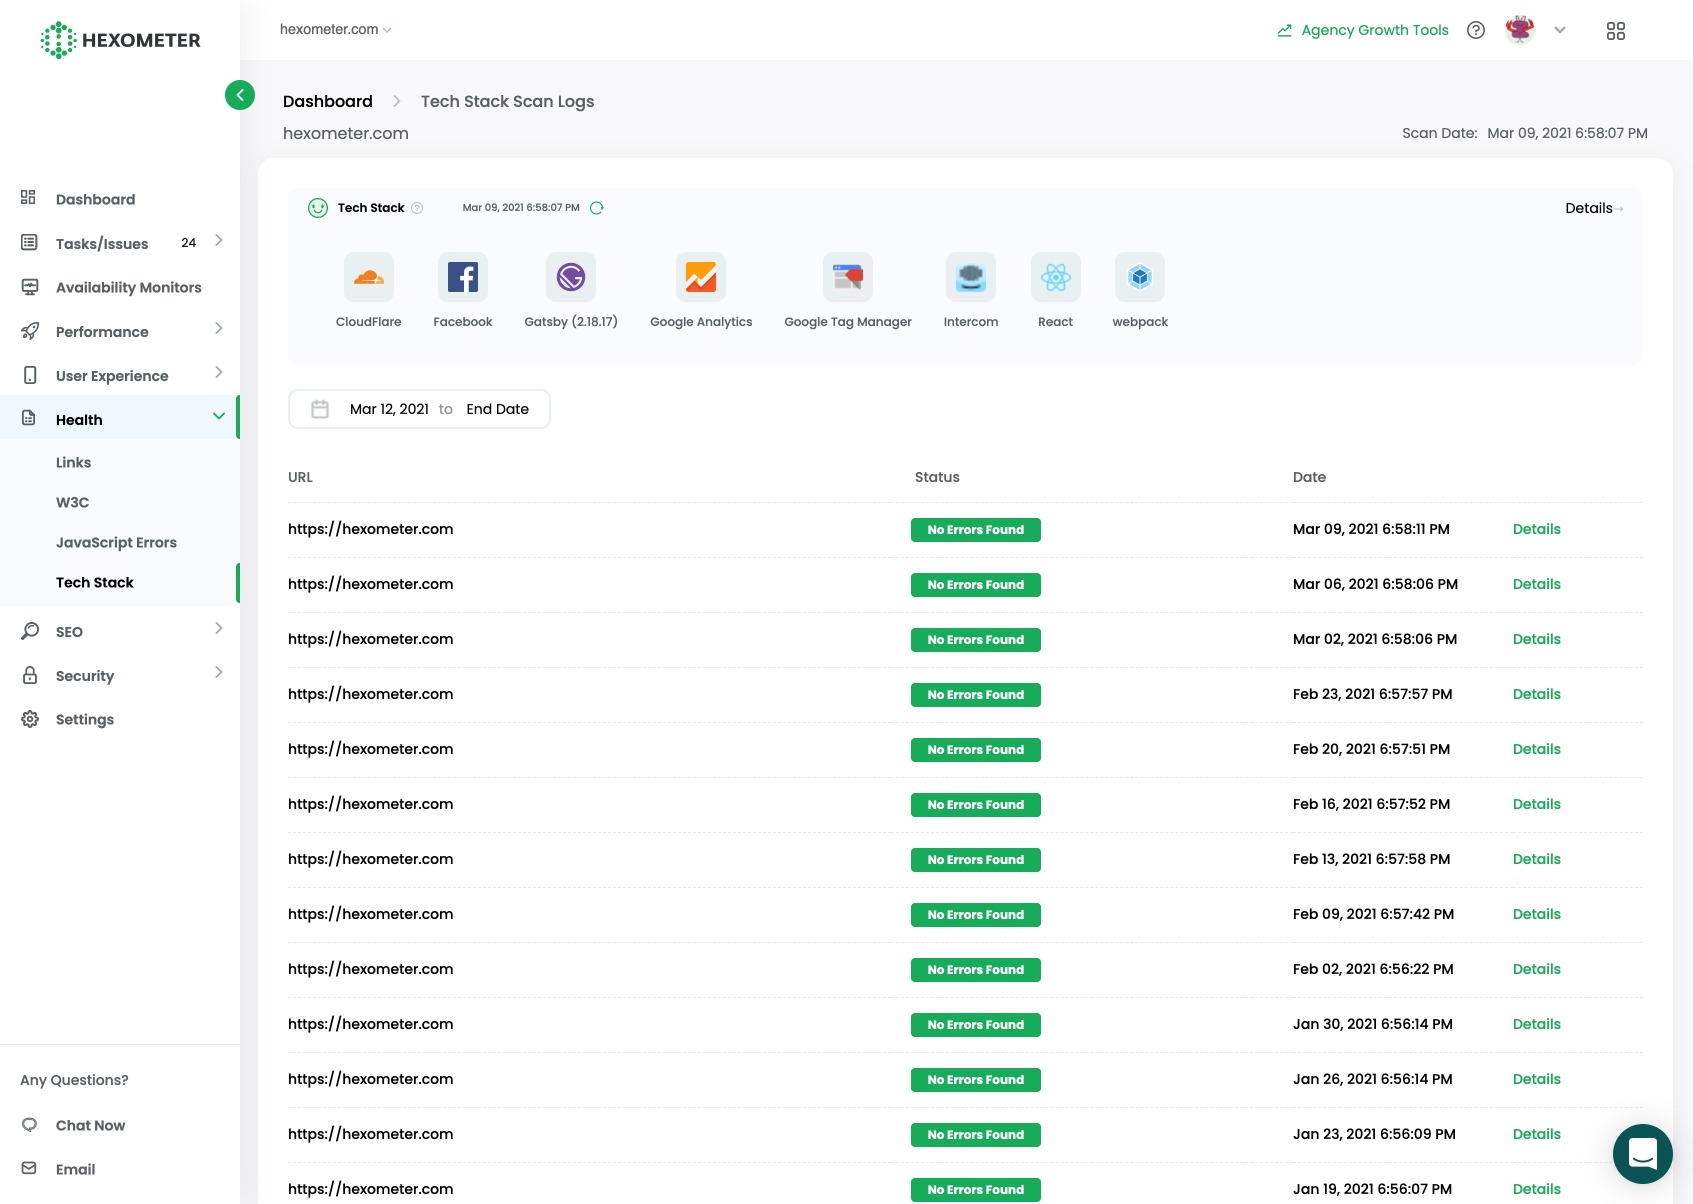
Hexometer monitors your website daily for tech stack changes that could impact your business and alerts you when important technologies go missing. For example it can alert you if your team deletes your Google analytics tag by mistake or when 3rd party libraries go missing or new ones are detected.
CMO & Co-founder
Helping entrepreneurs automate and scale via growth hacking strategies.
Follow me on Twitter for life behind the scenes and my best learnings in the world of SaaS.
