
Analyzing your website can tell you a lot of interesting information. A tool can show the speed of your website; how images might be affecting its performance; insights into your script, JavaScript, and CSS; how your Content Delivery Network (CDN) is performing; and, last but not least, the functionality of your HTTP headers. By getting all of this, you can essentially learn if there are unnecessary spaces in your code, and how long it takes for your browser to receive information after it requests it from a server.
Now the question is what tool should you use? Below are some of the best free and paid tools on the market, and each one is different and offers distinctive advantages. Take a look and see what works best for you.
Hexometer.com

Hexometer.com is a fantastic platform because it allows you to continuously monitor the performance of your website, keeping an eye out for downtime, SEO issues, broken pages, JS errors, security, configuration issues as well as page speed insights. It can check a multitude of things 24/7, and you get an easy to digest report on their website and straight to your email.
Google PageSpeed Insights
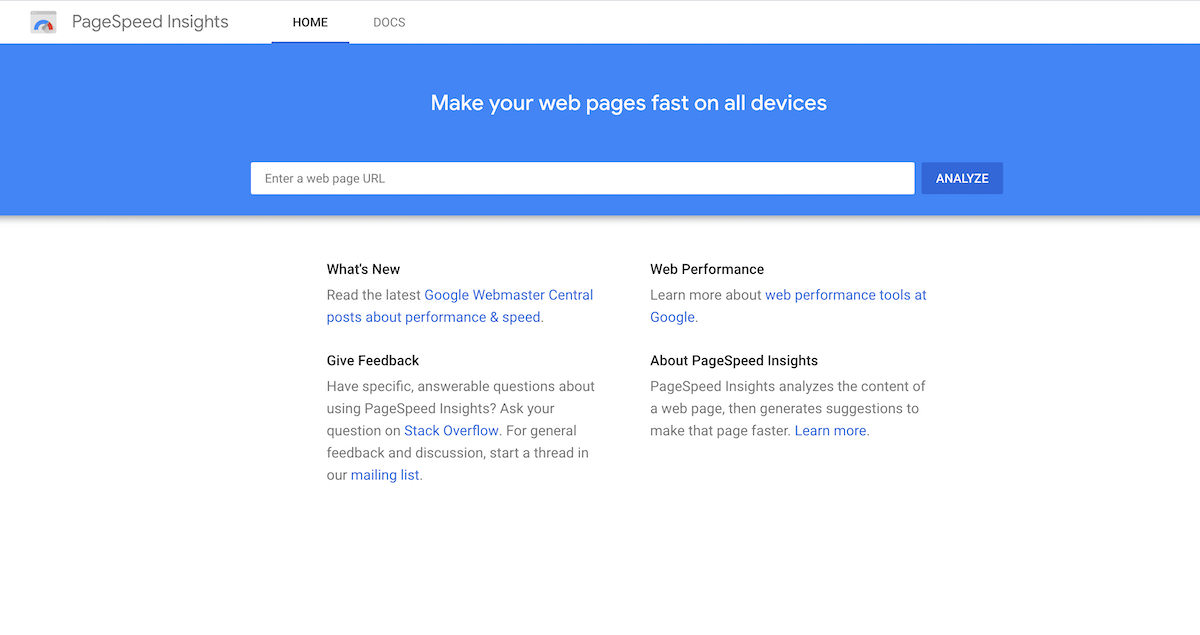
Google offers a simple ranking from 1-100 for your site. Get a score over 85 and be confident that your site is fast and performing well. As a bonus, you can test the speed of the desktop and mobile versions of your website. Finally, the tool makes valuable suggestions for optimizing your site, from cleaning up your CSS to refining your image quality.
KeyCDN Website Speed Test
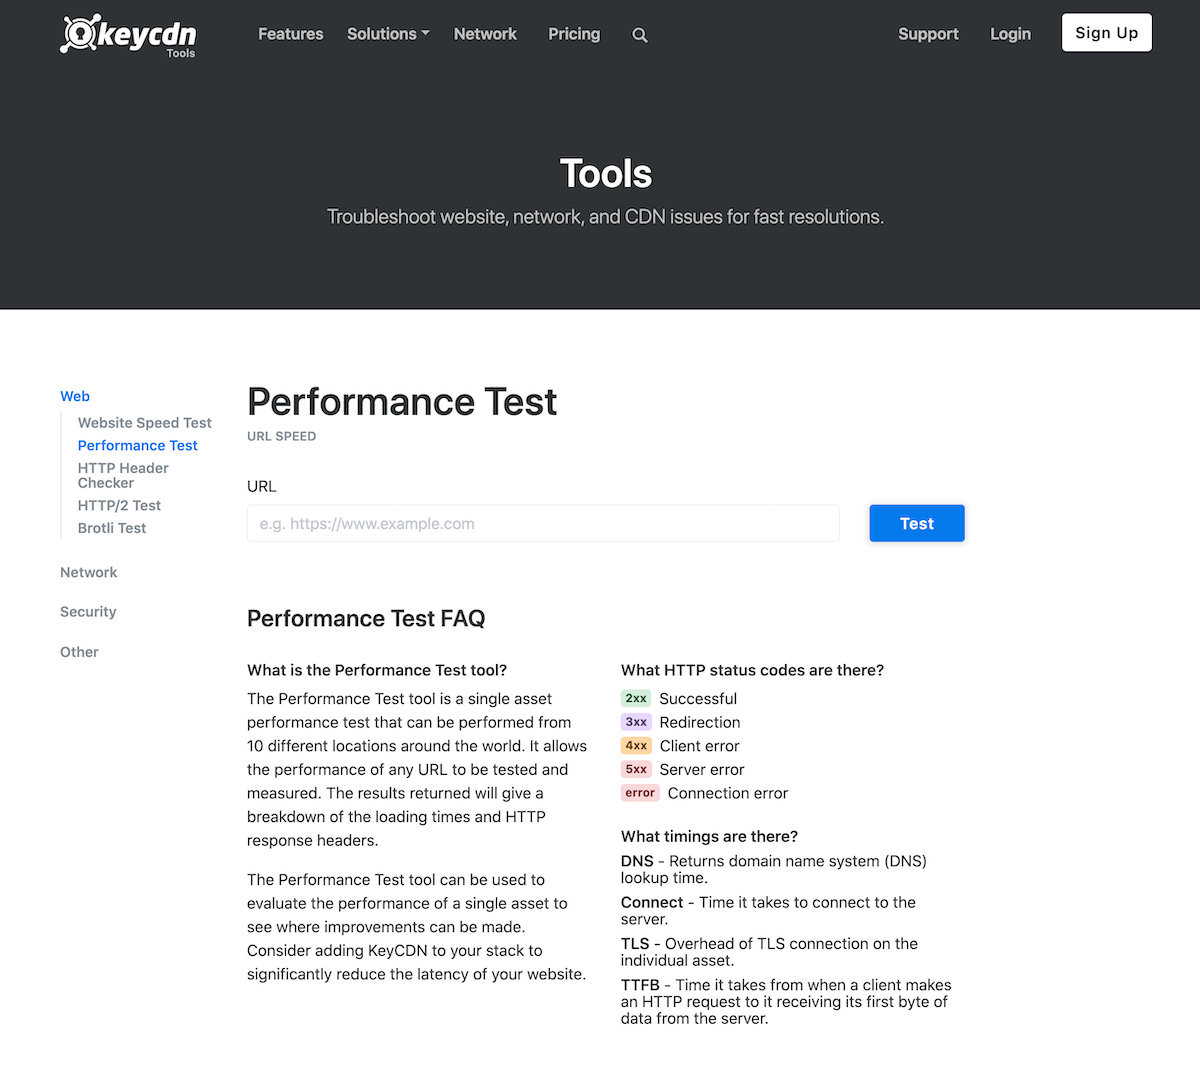
This fast and lightweight tool is perfect for testing the speed of your site, and you have the option of making your results private or public. Along with PageSpeed, which is another tool, it is responsive on mobiles and its quality is not compromised on the smaller screen. Use it to see how many HTTP requests were made and load times.
Pingdom Tools SpeedTest
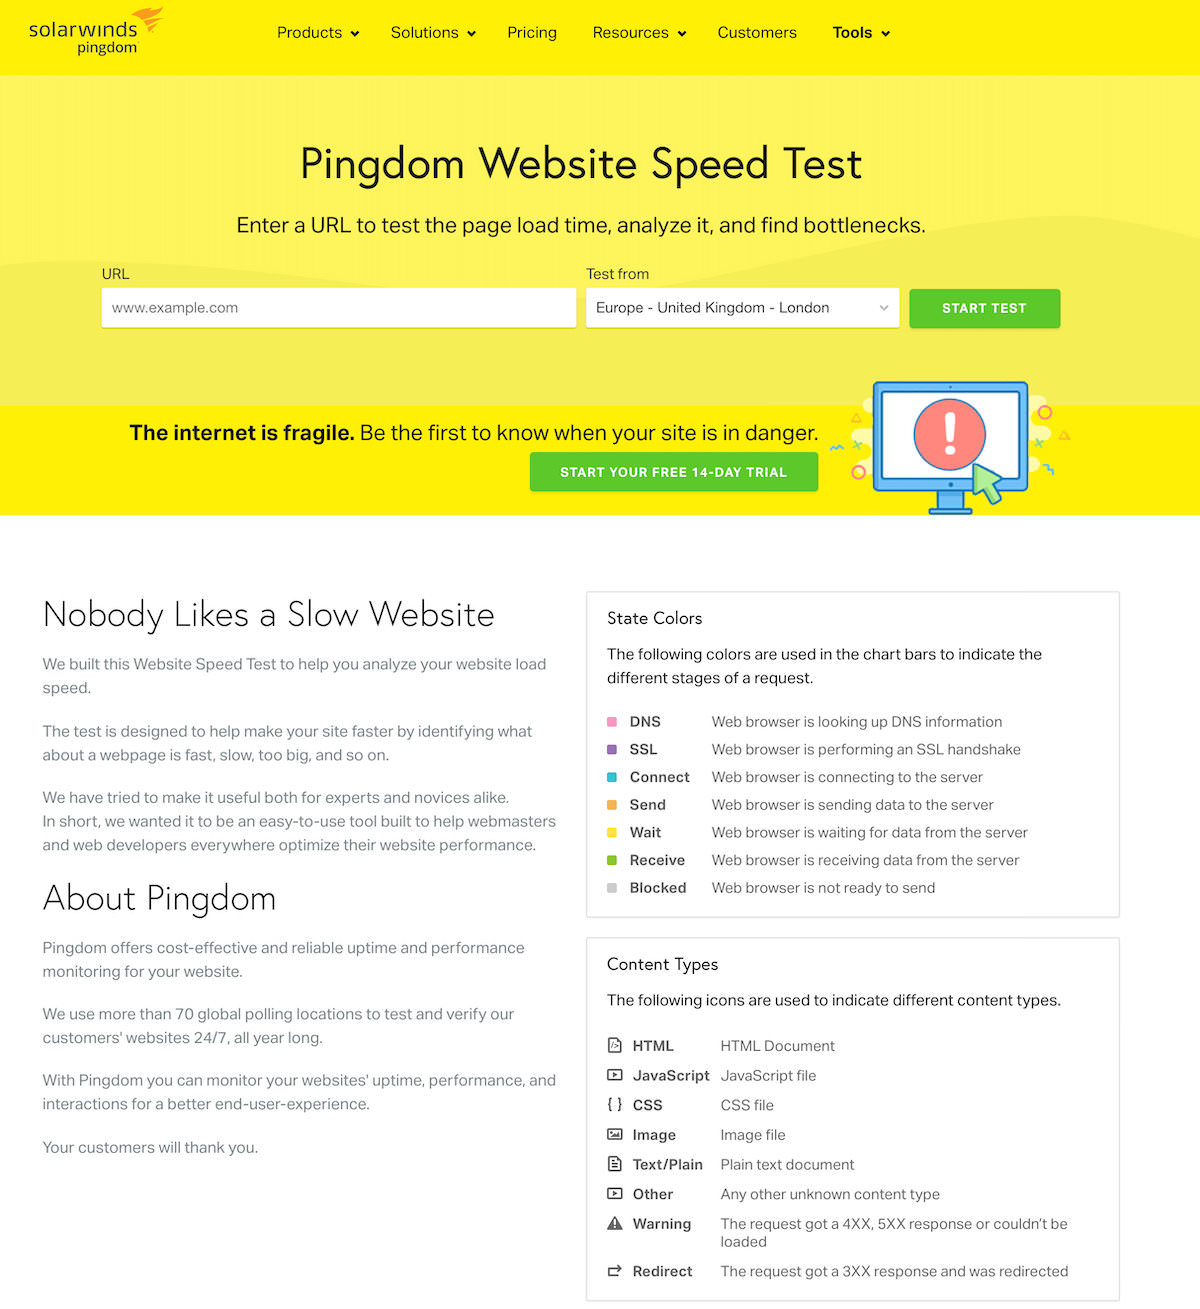
Pingdom is one of the most well-known tools, and they offer insight across four categories: waterfall breakdown, performance grade, page analysis, and history. You can test your website in four locations around the world to see if everything works well in diverse locations such as Texas, Melbourne, San Jose, and Stockholm. This tool also recommends changes that can be made to improve your site.
GTmetrix
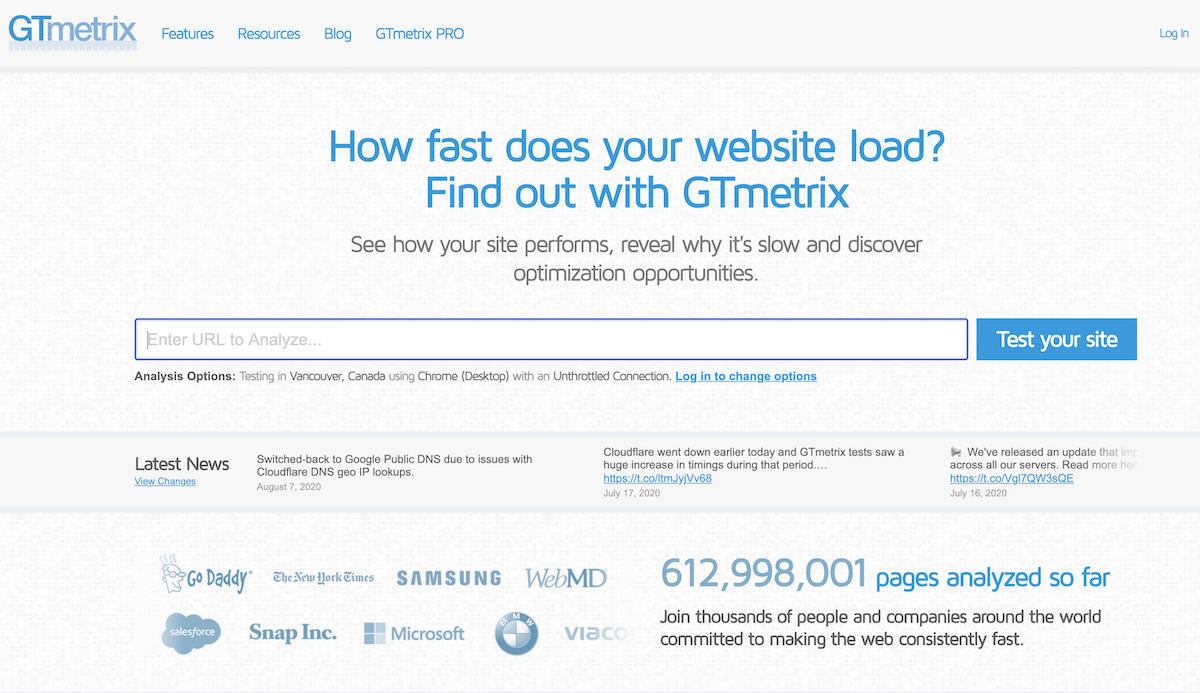
GTmetrix goes one better in that it offers a five-category breakdown of a website, and it checks both PageSpeed and YSlow metrics. You can use this tool to get graded from A-F. GTmetrix enables a user to test in different locations, across different browsers, and other different connection types. Video capability shows where your site might be suffering a bottleneck, while the ability to run AdBlock Plus lets you see how adverts affect load speeds.
WebPage Test
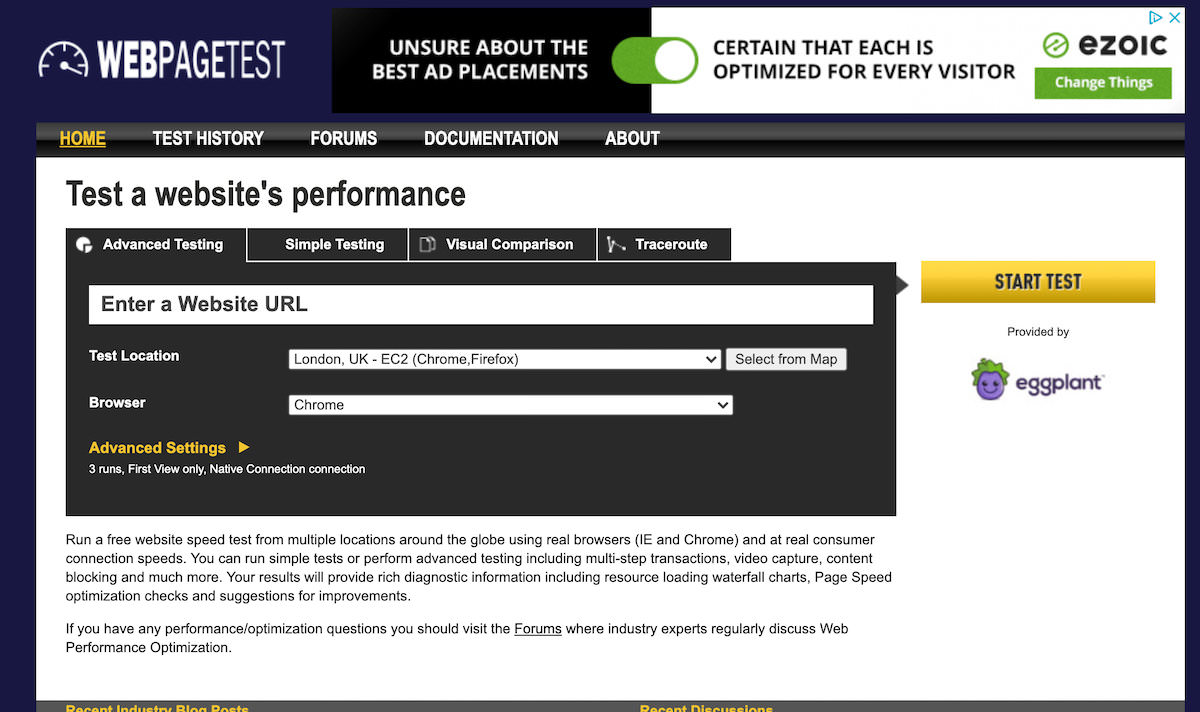
Like the previous tool, WebPage Test grades a website from A-F, but it has over 40 locations and over 25 browsers to choose from, which includes mobile. Its six-category breakdown provides summaries, details, performance reviews, screenshots, and content breakdown. The first view and repeat view option means you can test if an issue is really an issue. Aside from this, you can utilize advanced features, such as ignoring SSL certificates and spoofing user agent strings.
Dareboost
Dareboost provides in-depth website performance audits to help you test and optimize your website performance. You can use their synthetic monitoring tool to oversee the front-end performance of your core pages.
Site24x7
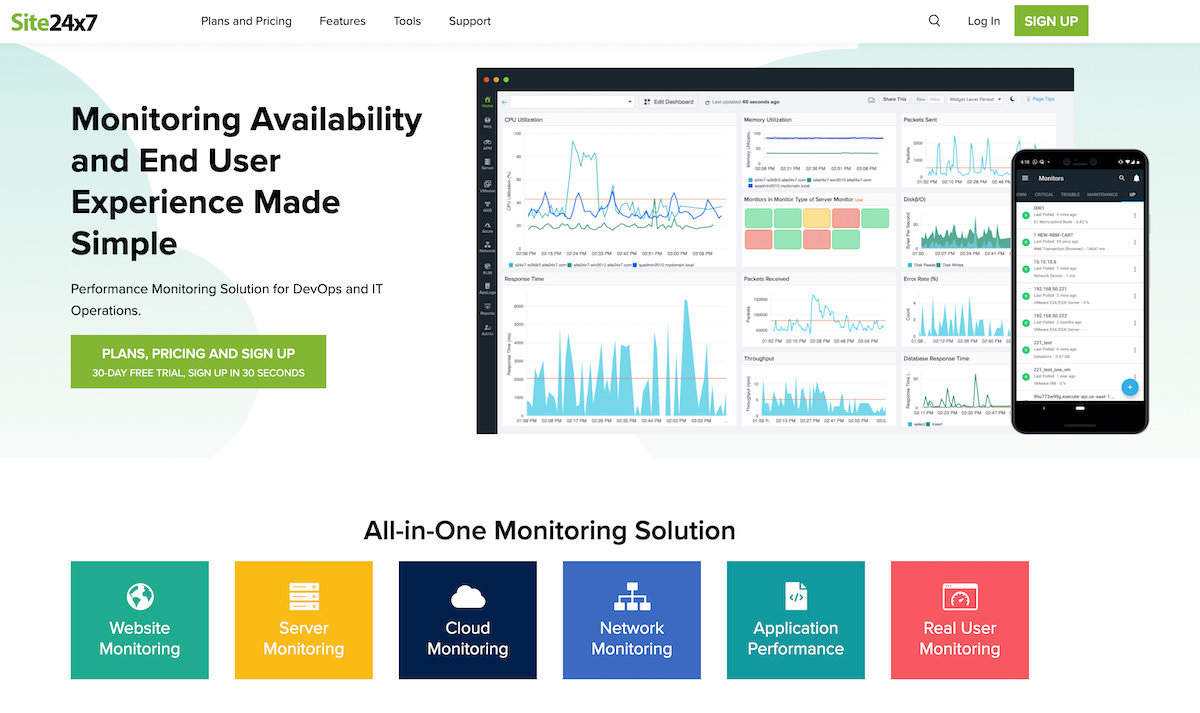
Site24x7 is a comprehensive suite of page speed and uptime monitoring tools designed to help notify you when pages go down, and monitor performance metrics of your homepage, server and apps.
Uptrends
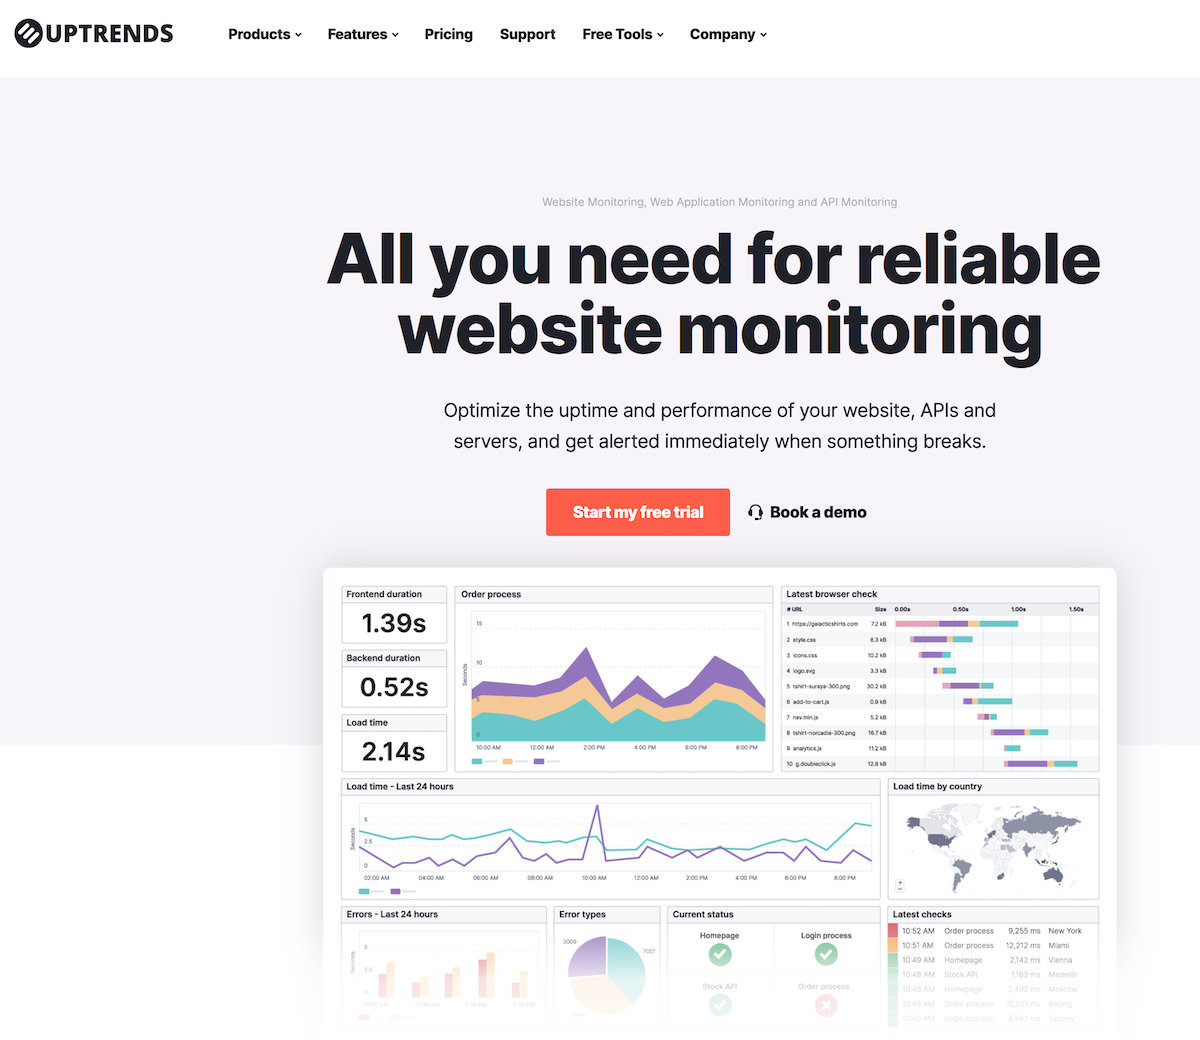
Uptrends provides a waterfall breakdown of your pages performance as well as a suite of uptime monitoring services, though the latter is categorized so that you can get key insight into these groups’ sources. It offers over 35 locations.
dotcom-monitor
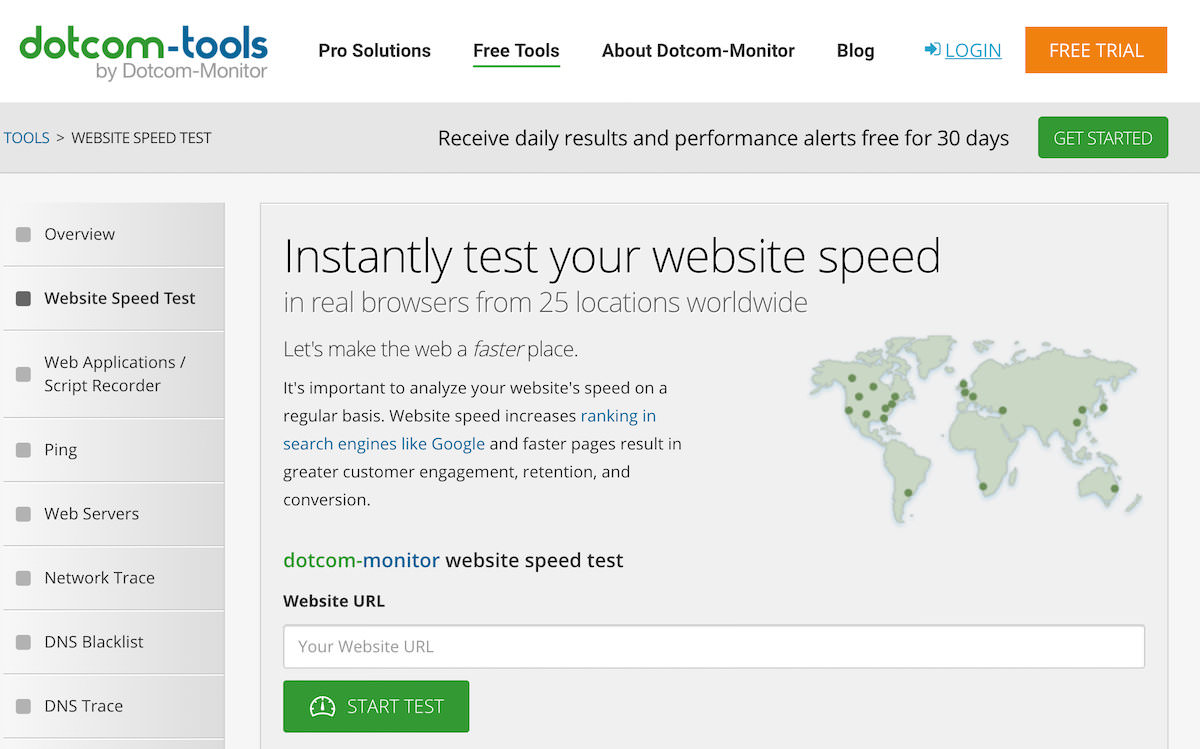
This tool is similar to the others, but it has the advantage of allowing you to run your geographical analyses simultaneously, so you can monitor 23 unique locations at the same time.
Yellow Lab Tools
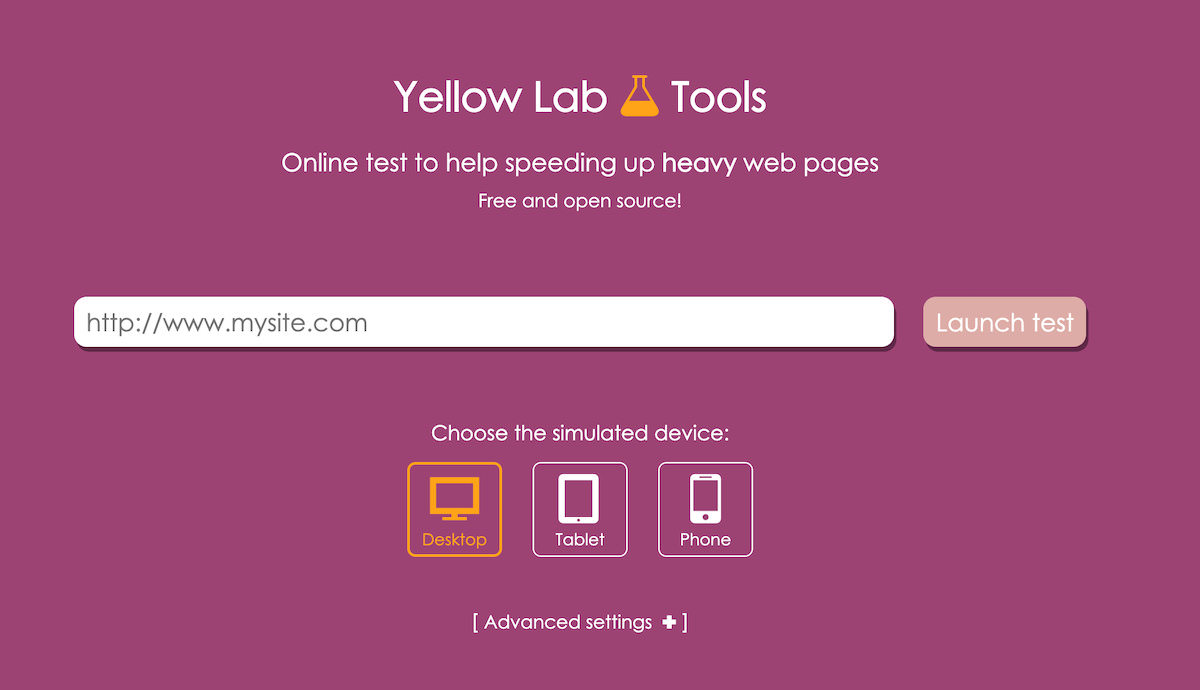
Newer on the market and with some unique features, Yellow Lab Tools is an interesting choice. It analyses frontend quality and it allows you to monitor code validation issues and JavaScript interactions with the DOM during page loading. You can also get a global score on things like bad CSS, page weight, and server config.
Google Chrome Dev Tools
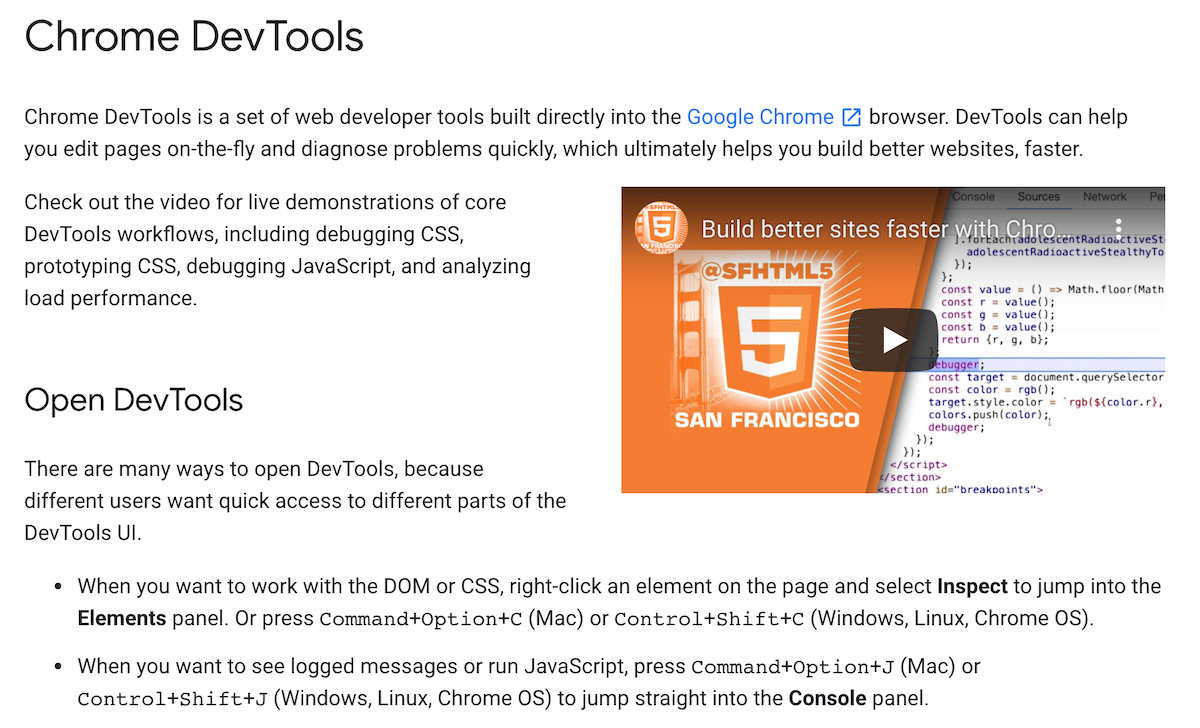
This tool works wonderfully – and unsurprisingly – with your Google browser. It is simple to use, and it comes with some nice advanced features. Use the aggregated detail panel to learn with more precision about the issues slowing down your website.
Sucuri Load Time Tester
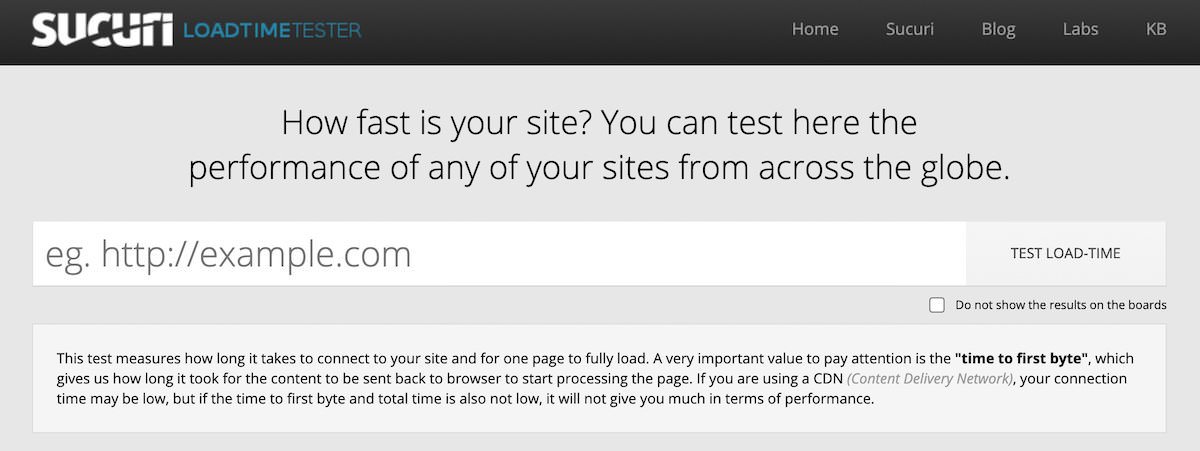
Use Sucuri to get an easy and fast understanding of how your site performs around the globe by testing how long it takes for a page to fully load and page connection speed. You can look at the important metric of ‘time to first byte’ and get a general understanding of performance through the tool’s A-F scoring system.
Pagelocity
Pagelocity is a little bit different because it offers a score from 1-100, and this score is based on factors such as SEO, social, code, and resources. You can even take a look at how your competitors are performing.
PerfTool
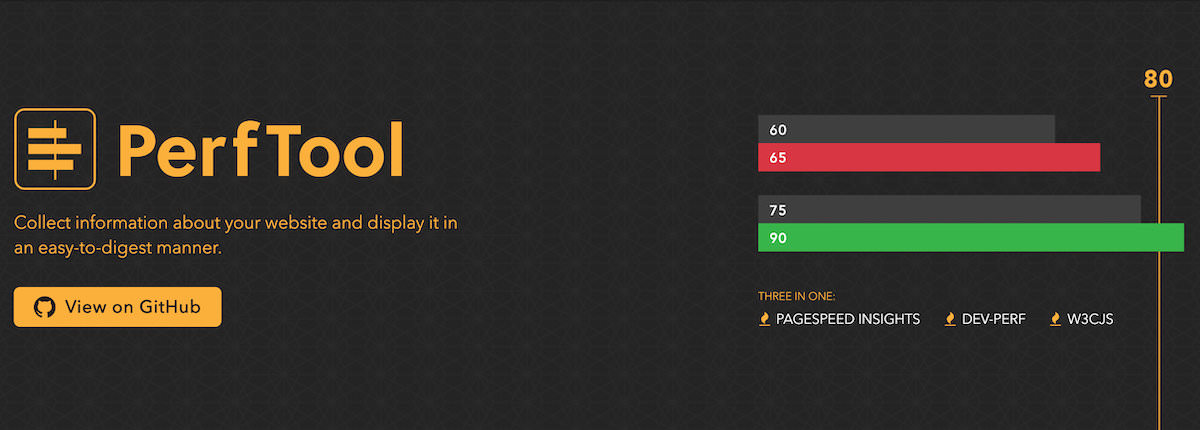
PerfTool is also open-source, and it is a tool that has been developed on the client-side. Overall, it gives you over 200 performance indicators. It uses PageSpeed Insights, devperf, and W3CJS. A big advantage is that you can run multiple page tests at the same time, and you can even save more time by comparing results from previous tests.
YSlow
YSlow is an open-source tool and it tests websites based on Yahoo!’s 23 rules for high-performance websites – two of these rules refer to using a CDN and reducing DNS lookups. It does this by crawling the DOM to find all components, getting information about the size of each component, and grading each rule before giving an overall grade. You can find Yslow in your favourite web browser under dev tools options.
CMO & Co-founder
Helping entrepreneurs automate and scale via growth hacking strategies.
Follow me on Twitter for life behind the scenes and my best learnings in the world of SaaS.