In this tutorial we are going to walk you through how to use the performance monitoring section of Hexometer and how to perform on-demand performance audits on your most important pages.
Why page speed performance matters
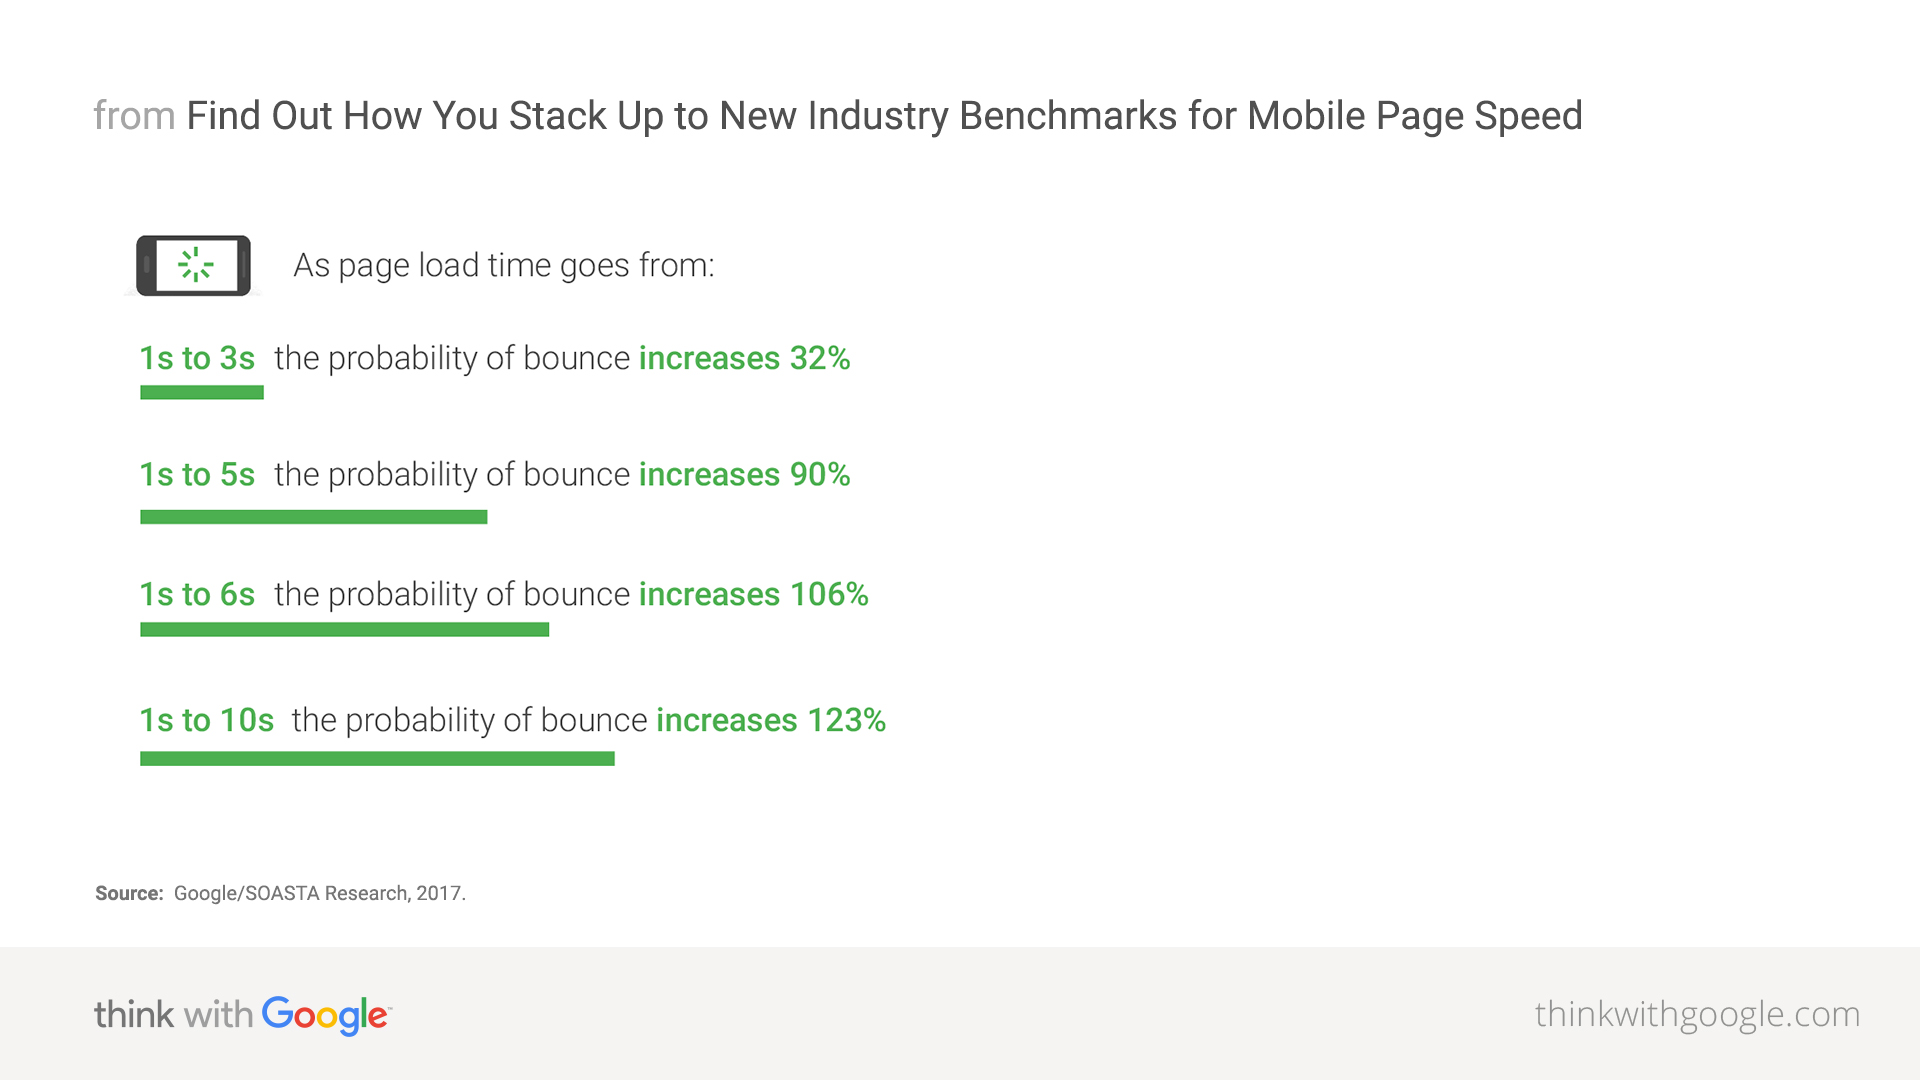
According to Google, the probability of a visitor bouncing (meaning leaving immediately without taking any action) increases by 32% when your page takes up to 3 seconds to load, and increases by 90% when it takes up to 5 seconds compared to a sub one second page load.
To make matters worse, we now live in a mobile first world where the majority of visits are now made on mobile devices, with varying connection speeds making website performance an important deciding factor.
Hexometer helps you keep an eye on the performance of your pages and spot problems before they affect your business.
Getting started with performance monitoring
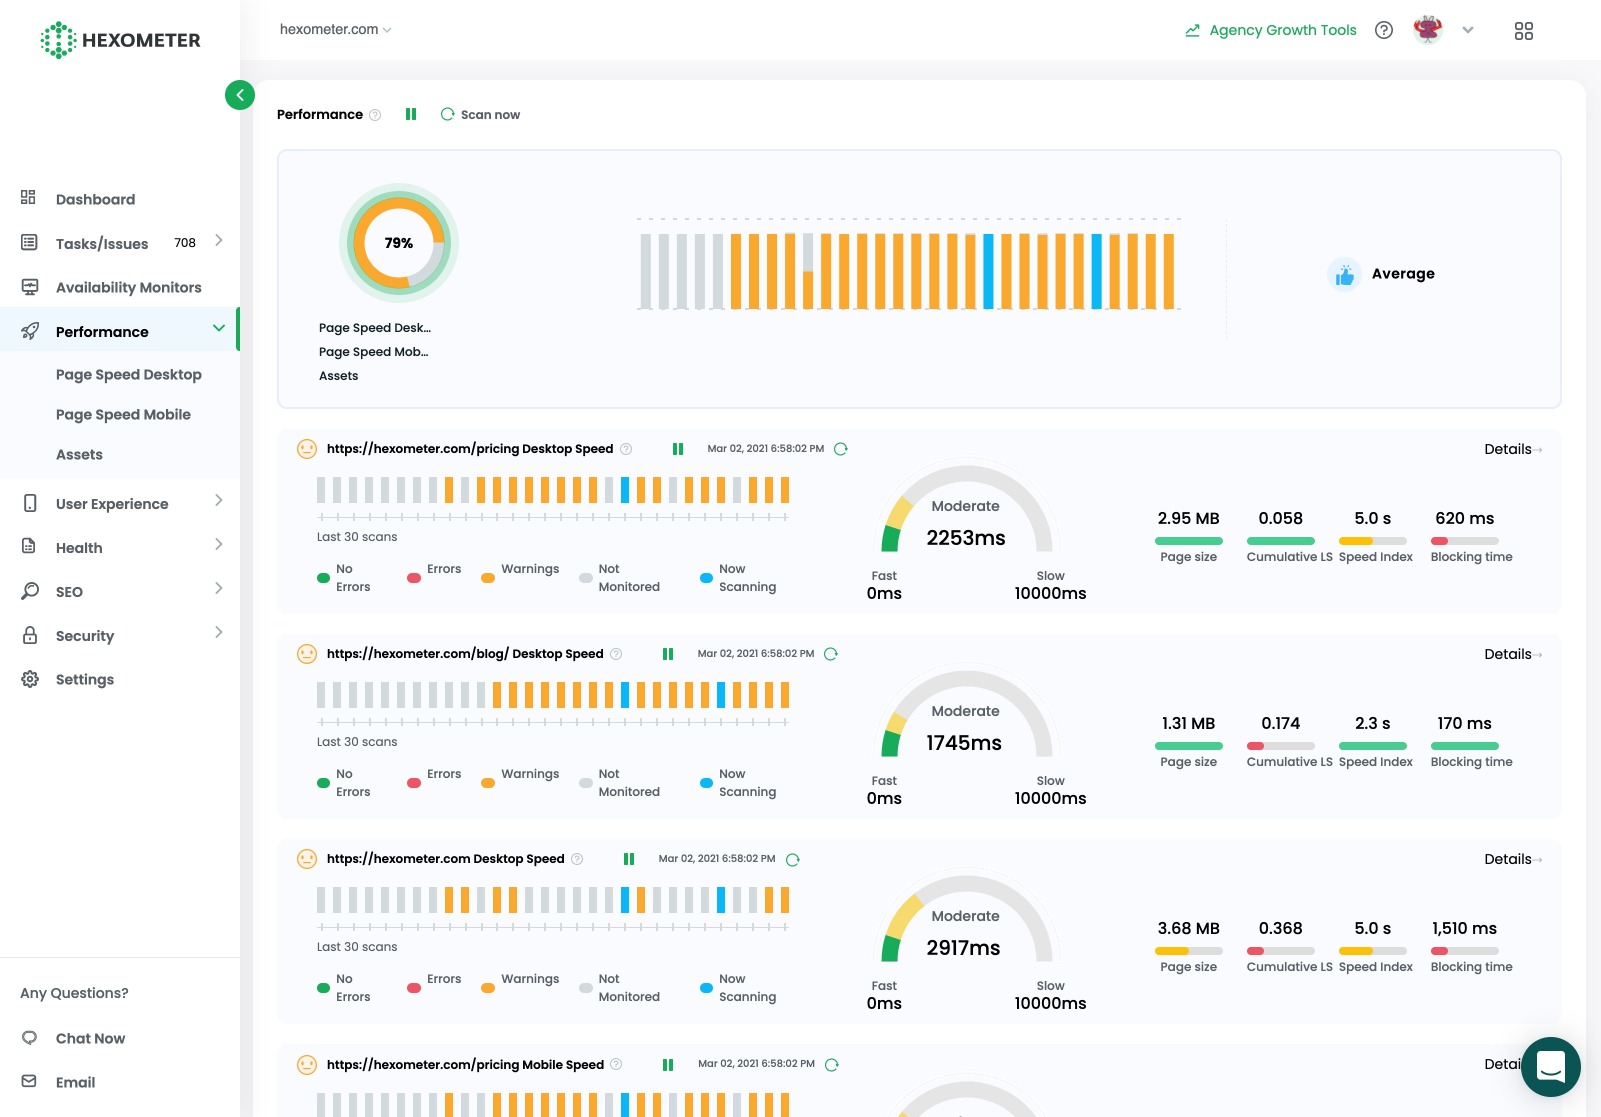
To get started, head over to the performance section. Here you will see top level metrics for your monitored pages.
If you’re using the default Hexometer smart crawler setting, Hexometer will periodically perform in-depth performance checks on your most important or recently updated pages as a mobile or desktop device.
Running on-demand checks to diagnose issues
Schedule page speed performance checks on your most important pages
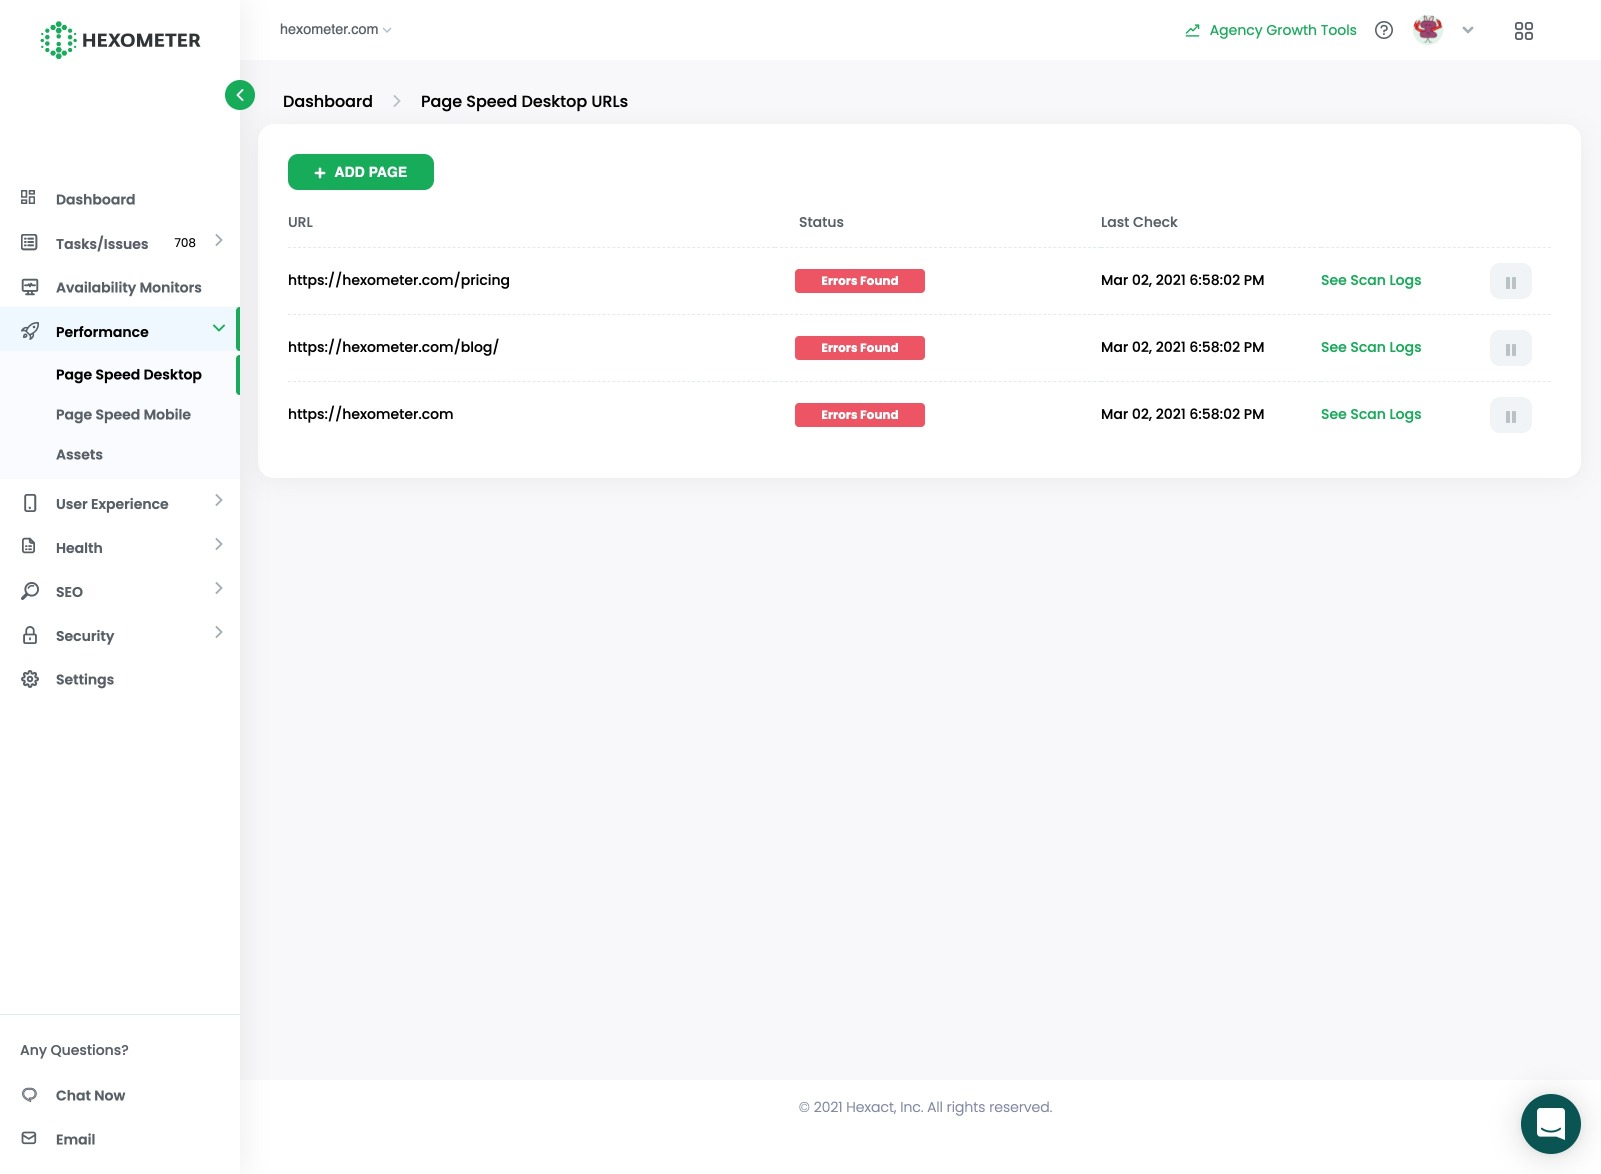
You can also run on-demand performance checks on any of your pages and schedule these to run on a daily, weekly or monthly basis based on your Hexometer account settings.
To access historical performance reports click on see scan logs.
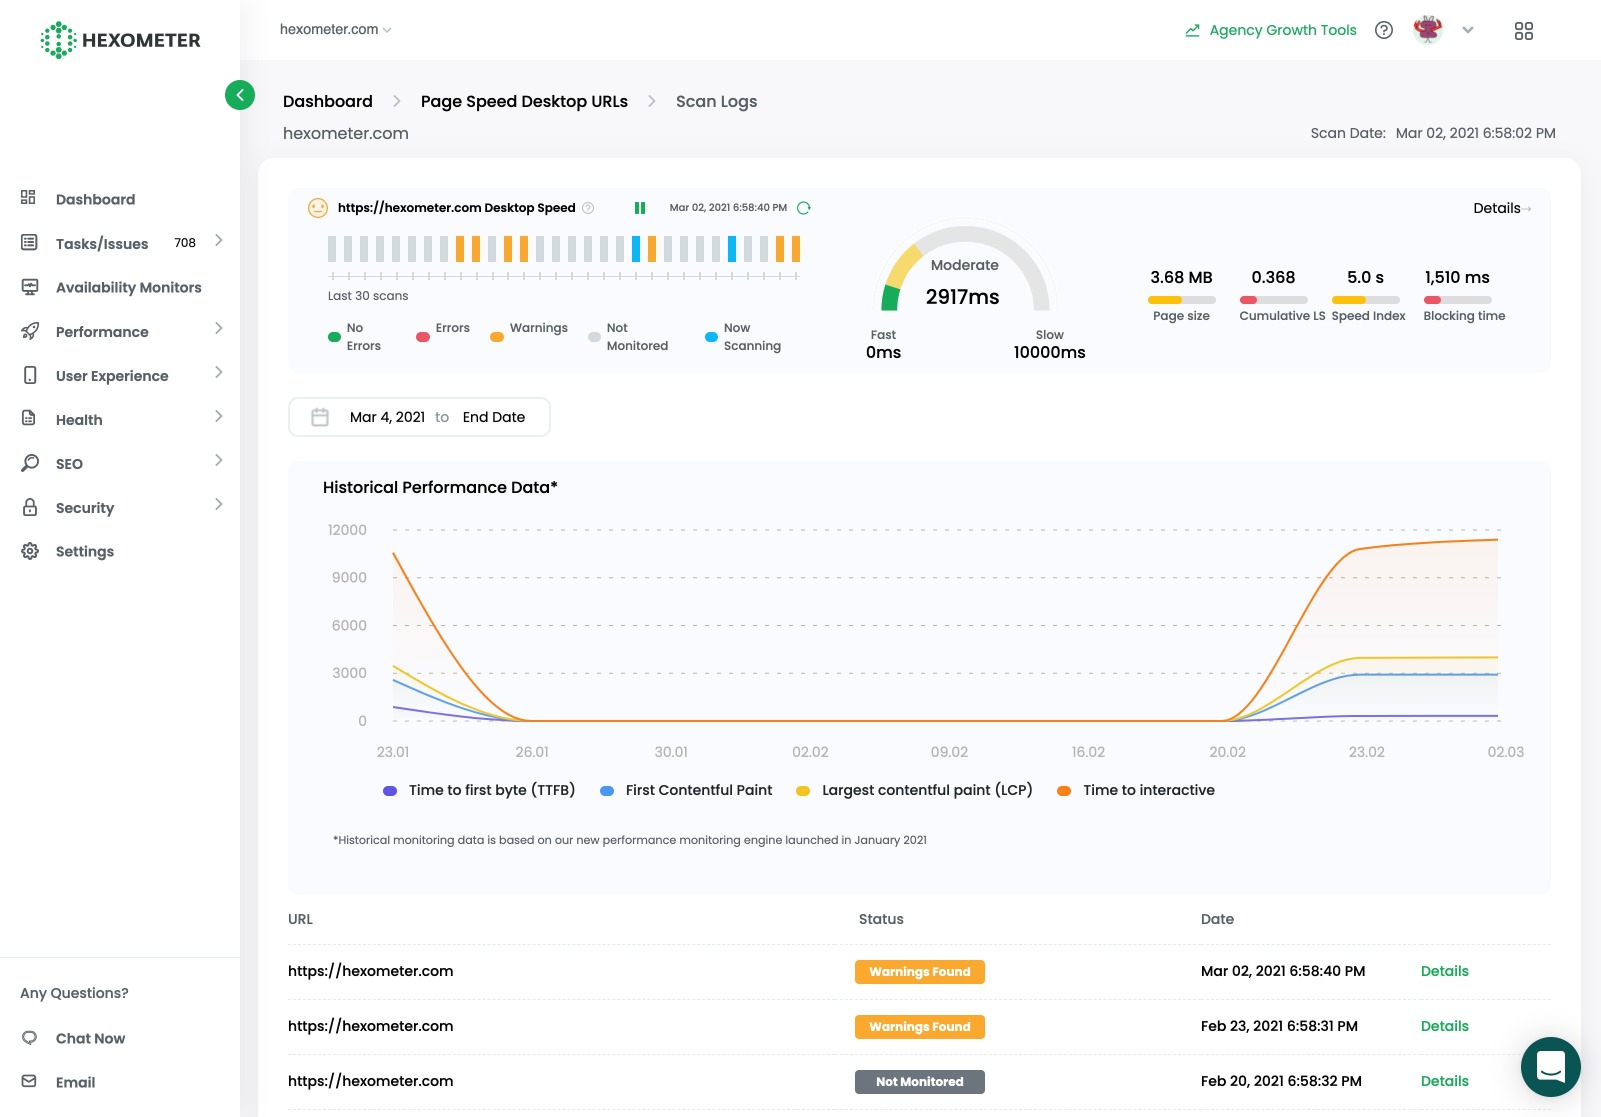
Here you will be able to see top level page speed performance metrics such as TTFB, Google Web Vitals, page size and page load time on a day by day basis.
To see the full report for a specific day, click on the details button.
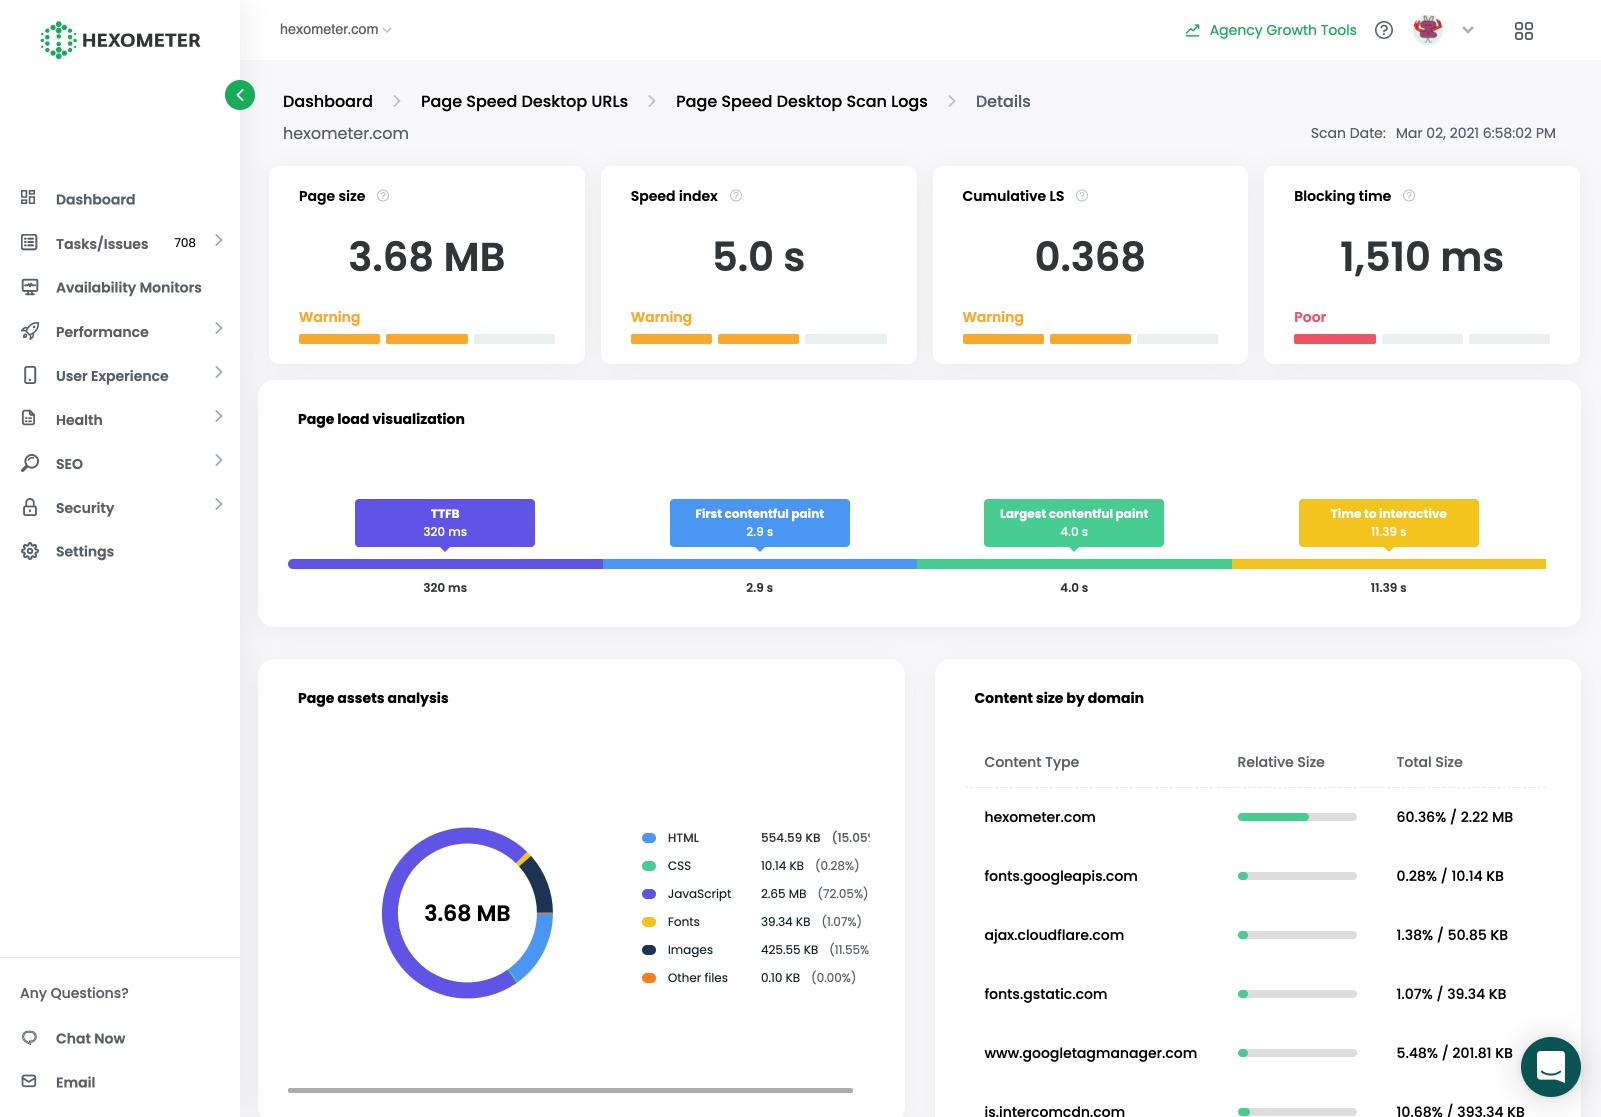
The performance report provides detailed information about how your page loads, performance metrics to identify bottlenecks as well as performance insights and suggestions to improve page speed.
CMO & Co-founder
Helping entrepreneurs automate and scale via growth hacking strategies.
Follow me on Twitter for life behind the scenes and my best learnings in the world of SaaS.