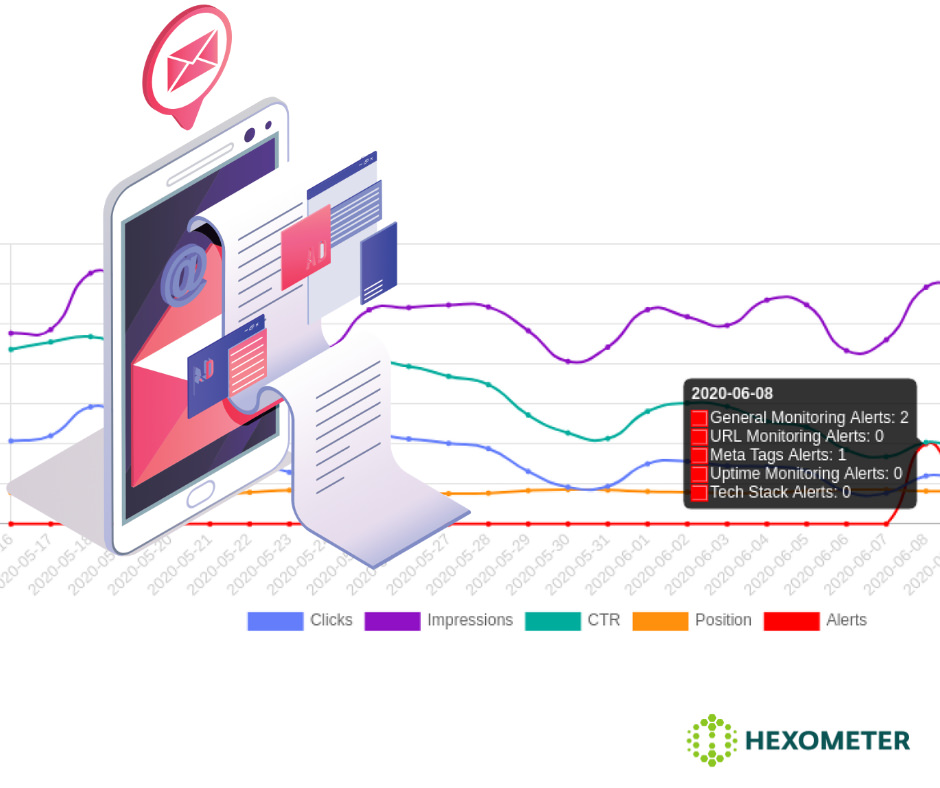
The Google search console platform provides a wealth of information directly from Google, including how many times your website has appeared in the Google search results, how many clicks a page received, click-through rate and average position metrics. The problem is that these metrics don’t tell you what caused the drop or spike in performance.
Our engineers have been working on this problem and we are happy to announce the release of website health metrics in the context of google search console data. Uptime, broken links, SEO, tech stack and general monitoring alerts will now appear alongside your Google search console charts.
This is our first step towards getting a better picture of the cause and effects of search engine performance, with more to come later this year.
Next up we have added a new Google Pagespeed Insights recommendation metric called “Best Practices” which measures how well your website implements Google’s best practices for web page performance.
We also improved our UI and added the option to select multiple issues or tasks to ignore, making it easier to bulk ignore alerts.
Last but not least, we are making steady progress on our upcoming product launch. This is a product with so many uses that we are having a hard time narrowing down the core use-cases we will use as examples on our website 🙂
CMO & Co-founder
Helping entrepreneurs automate and scale via growth hacking strategies.
Follow me on Twitter for life behind the scenes and my best learnings in the world of SaaS.